
Dark Mode dashboards are becoming increasingly popular in the business world. In Power BI, using Dark Mode templates can help reduce eye strain, improve data visibility, and provide a modern look to your business reports.
In this article, we’ll explore the benefits of Dark Mode dashboards and showcase some of the best Power BI templates available in Dark Mode.
Sales Dashboard Template (Dark Mode)
The Sales Dashboard Template in Dark Mode provides a modern, visually appealing way to track monthly sales performance, conversion rates, and customer acquisition costs.
Key Metrics Tracked:
- Monthly and yearly revenue
- Sales pipeline status
- Conversion rates
- Customer acquisition costs
 Power BI Data Modeling: Best Practices
Performance Marketing Dashboard Template (Dark Mode)
The Performance Marketing Dashboard Template in Dark Mode is perfect for tracking campaign performance, click-through rates (CTR), and ROI. The Dark Mode version makes it easier for marketers to analyze data during extended working hours.
Key Metrics Tracked:
- Campaign ROI
- Click-through rates (CTR)
- Lead conversion rates
- Cost per lead

Human Resources Dashboard Template (Dark Mode)
The Human Resources Dashboard Template in Dark Mode provides an engaging, modern interface for tracking employee performance, attendance, and HR metrics.
Key Metrics Tracked:
- Employee attendance rates
- Performance evaluations
- Turnover rates
- Employee satisfaction scores

Operations Dashboard Template (Dark Mode)
The Operations Dashboard Template in Dark Mode helps businesses track workflow timelines, task completion rates, and department productivity. It offers a modern interface for busy teams.
Key Metrics Tracked:
- Task completion rates
- Workflow timelines
- Productivity by department

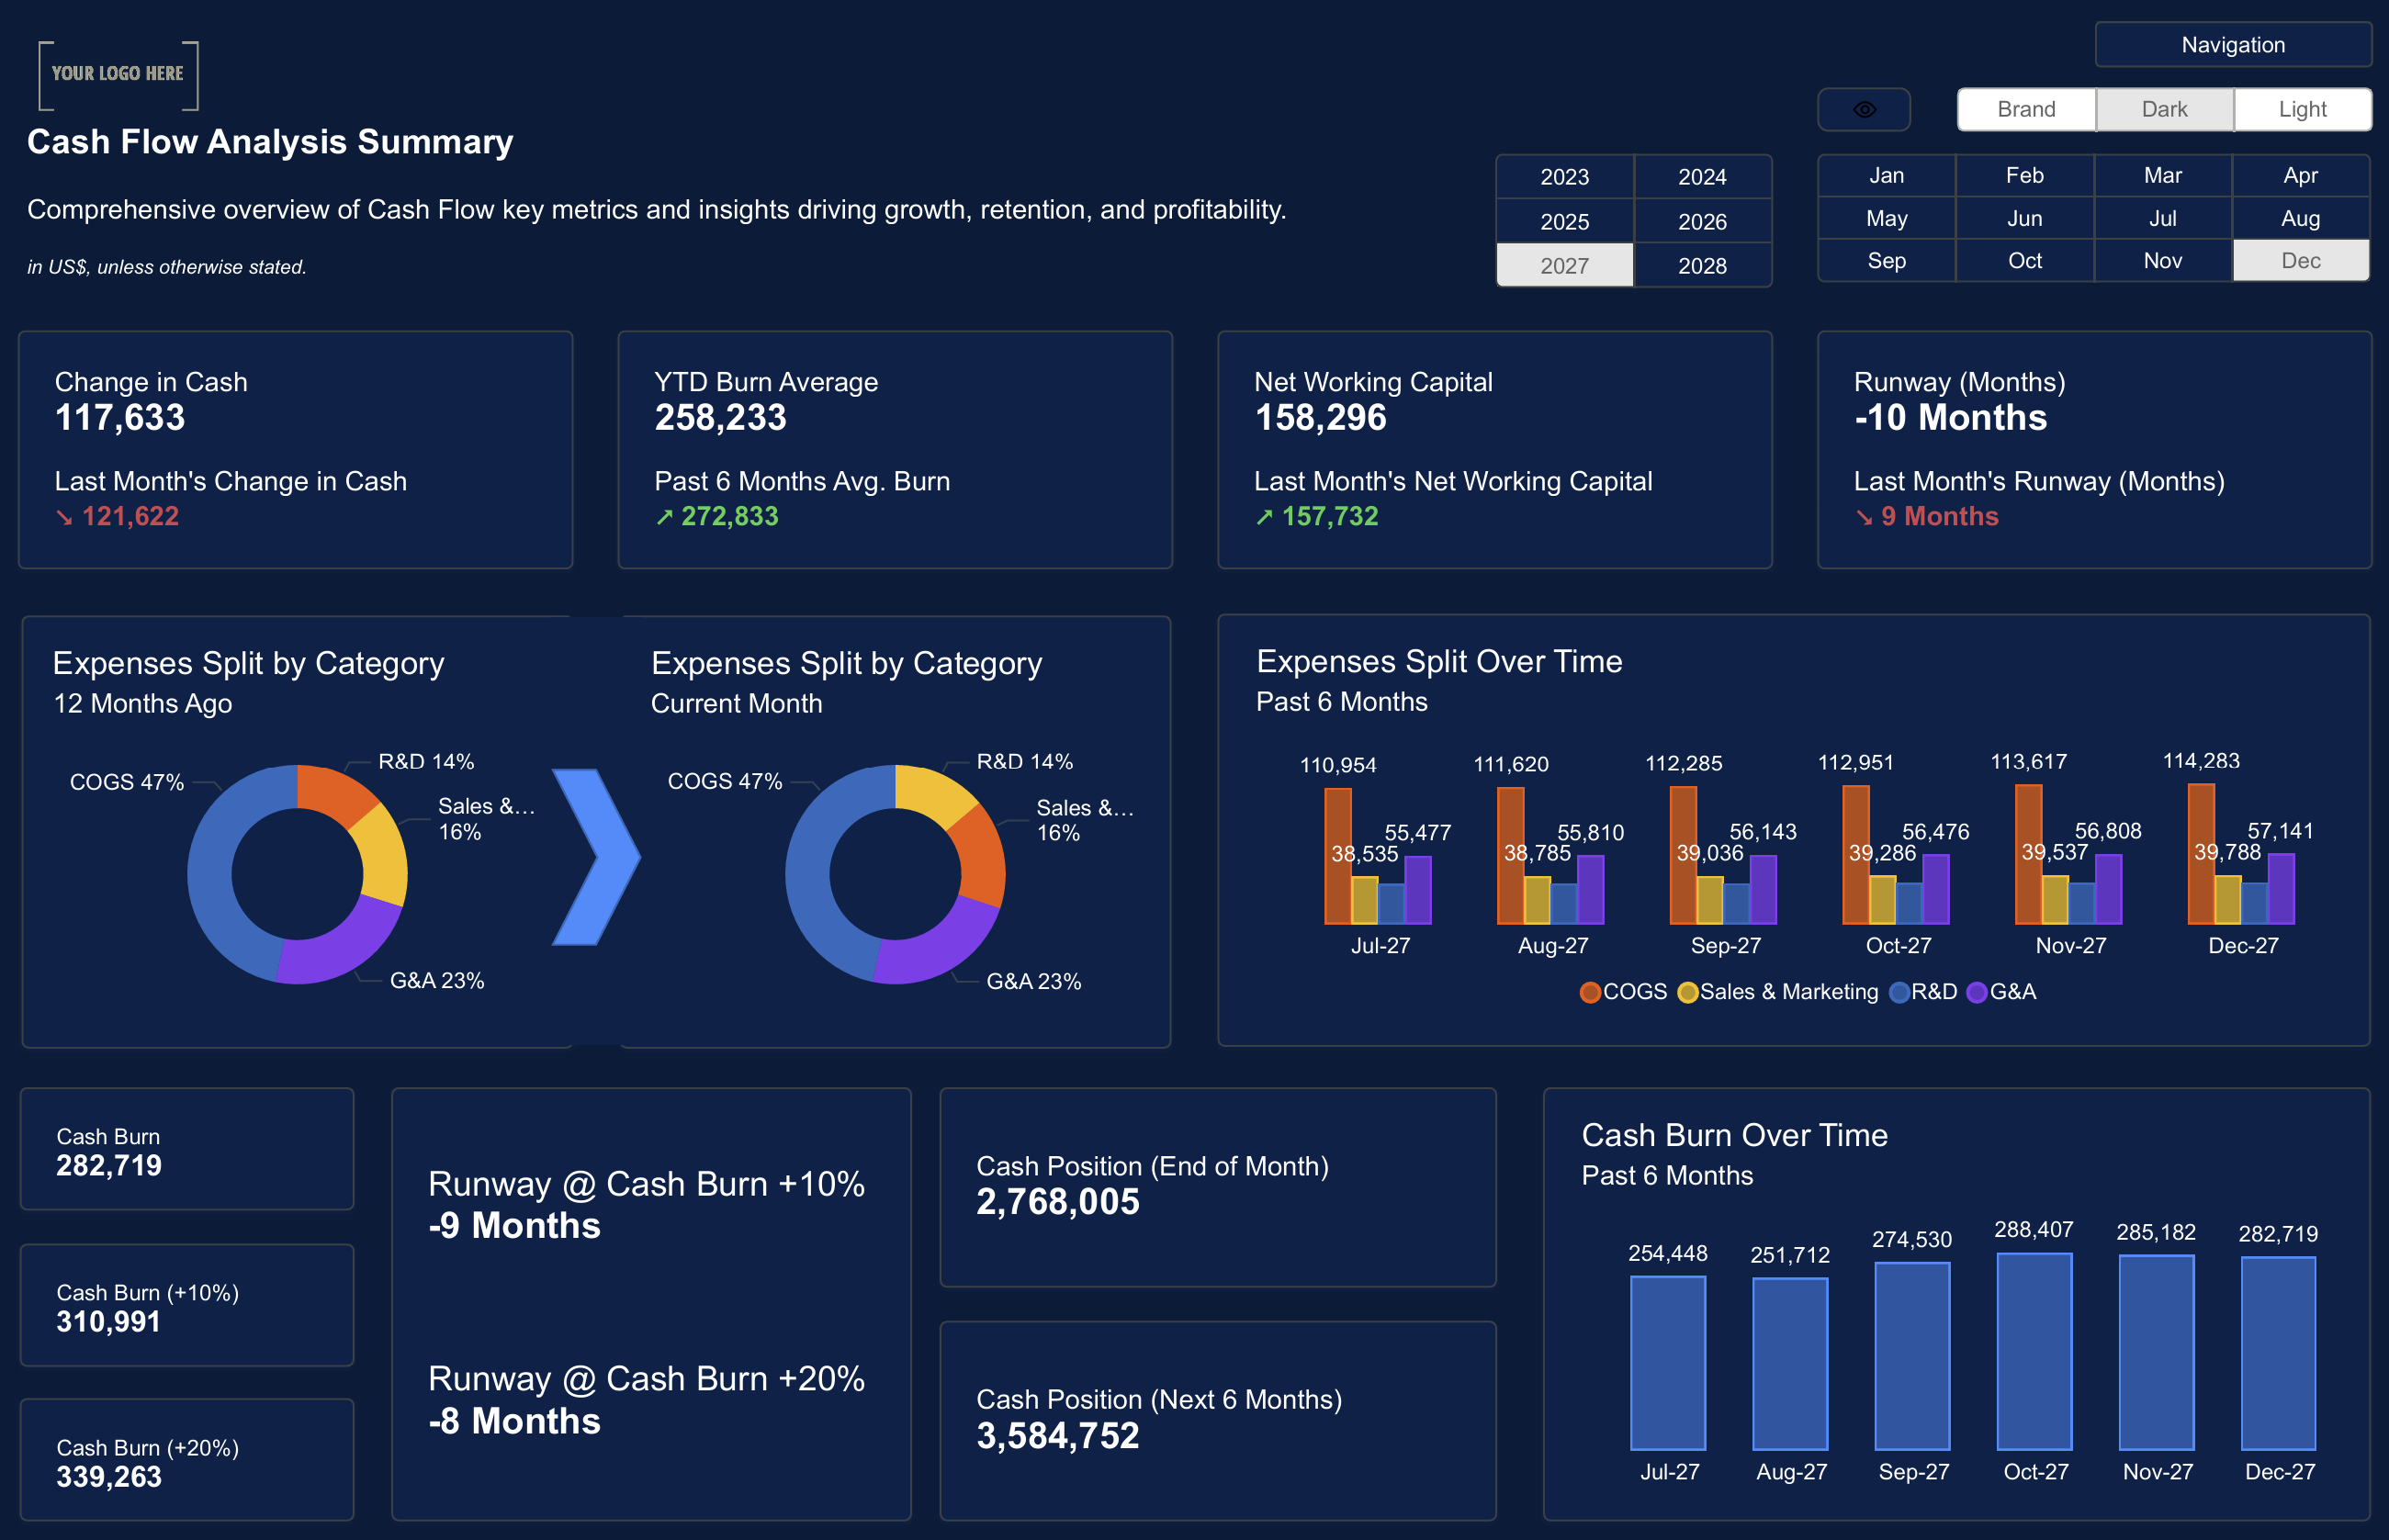
Cash Flow Analysis Dashboard Template (Dark Mode)
The Cash Flow Analysis Dashboard Template in Dark Mode provides clear insights into cash inflows, outflows, and net cash position, making it easier to monitor your company's financial health.
Key Metrics Tracked:
- Cash inflows by source
- Cash outflows by category
- Net cash position over time
- Projected cash flow
 Power BI Dashboards for Business Growth
Dark Mode dashboards in Power BI aren’t just visually appealing; they’re also practical. They can reduce eye strain, provide a modern design, and make your data insights easier to understand during long working hours.
Ready to explore more? Download our Dark Mode Power BI templates and take your reporting to the next level.
Download the Dark Mode Power BI Templates now and improve your business reporting with a modern, sleek design.Get Started >
Subscribe to our newsletter
Stay ahead with the latest insights, tips, and trends in PowerBI and data visualization.
Join the network that is unlocking the full potential of their data - one dashboard at a time.
Related posts
Explore more insights and tips with these related posts curated just for you.

Top 10 Power BI Dashboard Examples to Boost Business Insights

Mastering the Power BI Dashboard: Essential Tips for Effective Design
