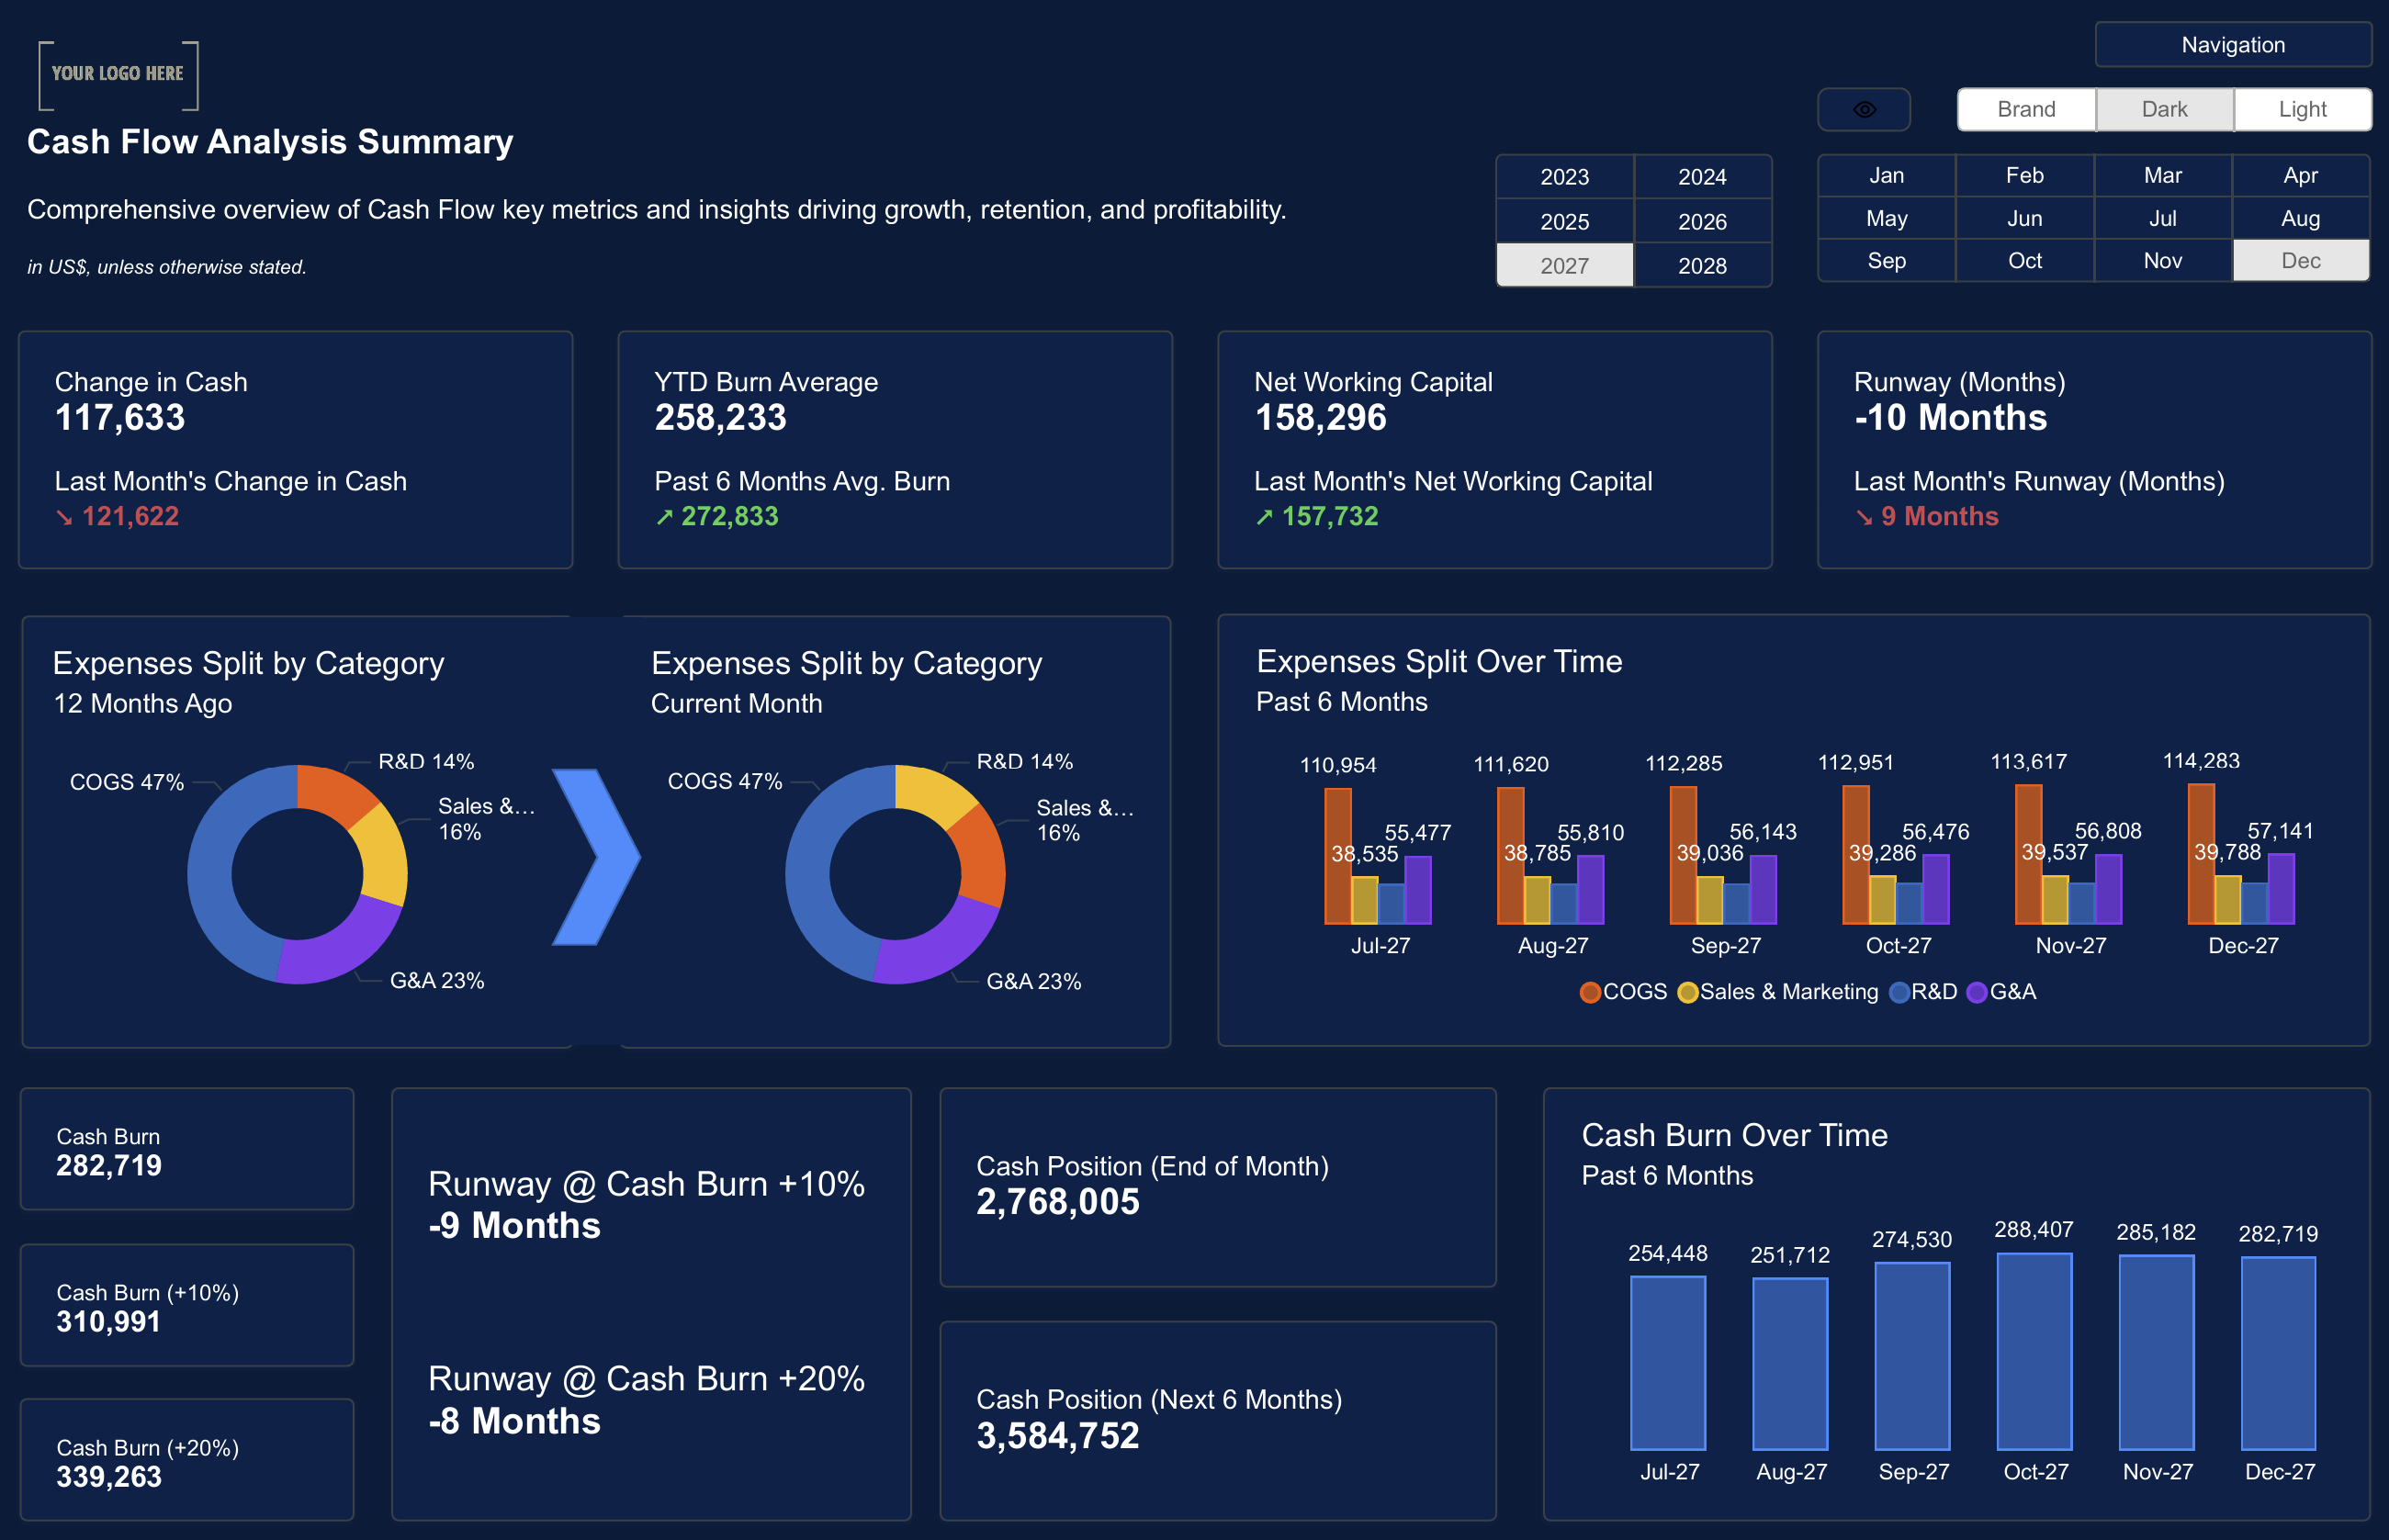
An effective Power BI data model is the foundation of any accurate and scalable dashboard. Without a solid model, dashboards can become slow, confusing, and prone to errors.
In this guide, we’ll explore best practices for Power BI data modeling that will help you build accurate, efficient, and scalable dashboards.
Understand Star Schema and Relationships
One of the most important concepts in Power BI data modeling is the star schema. It’s a way of organizing your data into fact tables and dimension tables to improve performance and make relationships easier to manage.
Key Tips for Using Star Schema:
- Use fact tables for numeric values (e.g., sales data).
- Use dimension tables for descriptive data (e.g., customer details).
- Ensure your relationships are one-to-many and optimized for performance.
 Power BI Data Modeling: Best Practices
Optimize DAX Calculations for Performance
DAX (Data Analysis Expressions) is a powerful formula language used in Power BI. However, poorly optimized DAX calculations can slow down your dashboards.
DAX Optimization Tips:
- Use SUMX, AVERAGEX, and other iterative functions carefully.
- Avoid nested calculations where possible.
- Use calculated columns sparingly and rely on measures instead.

Manage Table Relationships Effectively
In Power BI, managing relationships between tables is key to ensuring your data model works correctly. Improper relationships can lead to wrong calculations and slow performance.
Relationship Management Tips:
- Ensure your fact tables and dimension tables have clear relationships.
- Use active relationships for your primary data connections.
- Avoid circular relationships, which can create calculation errors.

Avoid Common Data Modeling Mistakes
Many Power BI users make common data modeling mistakes that can impact dashboard performance and accuracy. Here are some mistakes to avoid:
Common Mistakes:
- Overcomplicating relationships between tables.
- Using too many calculated columns.
- Ignoring data type mismatches, which can lead to errors.

Use Power BI Templates for Consistent Models
Using Power BI templates can help you create consistent data models across multiple dashboards. Templates ensure your models follow best practices and are easy to maintain.
Benefits of Using Templates:
- Save time by reusing data models.
- Ensure consistency across all reports.
- Simplify maintenance and updates.
 The Ultimate Guide to Customizing Power BI Templates for Your Business Needs
Power BI data modeling is essential for creating accurate, scalable dashboards that provide reliable insights. By following best practices for star schema, DAX optimization, and relationship management, you can build data models that are both efficient and easy to maintain.
Ready to take your dashboards to the next level? Download our Power BI templates to get started!
Download our Power BI Templates now and start building scalable, accurate dashboards with best practices for data modeling.Get Started >
Subscribe to our newsletter
Stay ahead with the latest insights, tips, and trends in PowerBI and data visualization.
Join the network that is unlocking the full potential of their data - one dashboard at a time.


