
Power BI dashboards have become essential for businesses to track performance and make data-driven decisions. But the way your dashboard looks can also impact how your team interprets data.
In this article, we’ll compare Light Mode and Dark Mode dashboards, exploring the advantages of each and how they can help you achieve business growth.
Light Mode Operations Dashboard Template
The Light Mode Operations Dashboard Template in Power BI is ideal for businesses that prefer traditional, clean visuals. It provides clear visibility into key metrics, such as task completion rates, workflow timelines, and productivity metrics.
Key Metrics Tracked:
- Task completion rates
- Workflow timelines
- Department productivity metrics
 Power BI Data Modeling: Best Practices
Dark Mode Operations Dashboard Template
The Dark Mode Operations Dashboard Template offers a modern, sleek design that’s easier on the eyes, especially during long working hours. It provides the same key insights but with a visually striking look.
Key Metrics Tracked:
- Task completion rates
- Workflow timelines
- Department productivity metrics

Human Resources Dashboard Templates (Light & Dark Mode)
For HR teams, the choice between Light Mode and Dark Mode dashboards depends on personal preference and working environments.
Benefits of Light Mode for HR Dashboards:
- Provides a traditional look that’s familiar to most users.
- Works well in bright office environments.
Benefits of Dark Mode for HR Dashboards:
- Easier on the eyes during extended use.
- Ideal for low-light environments or remote teams working at night.

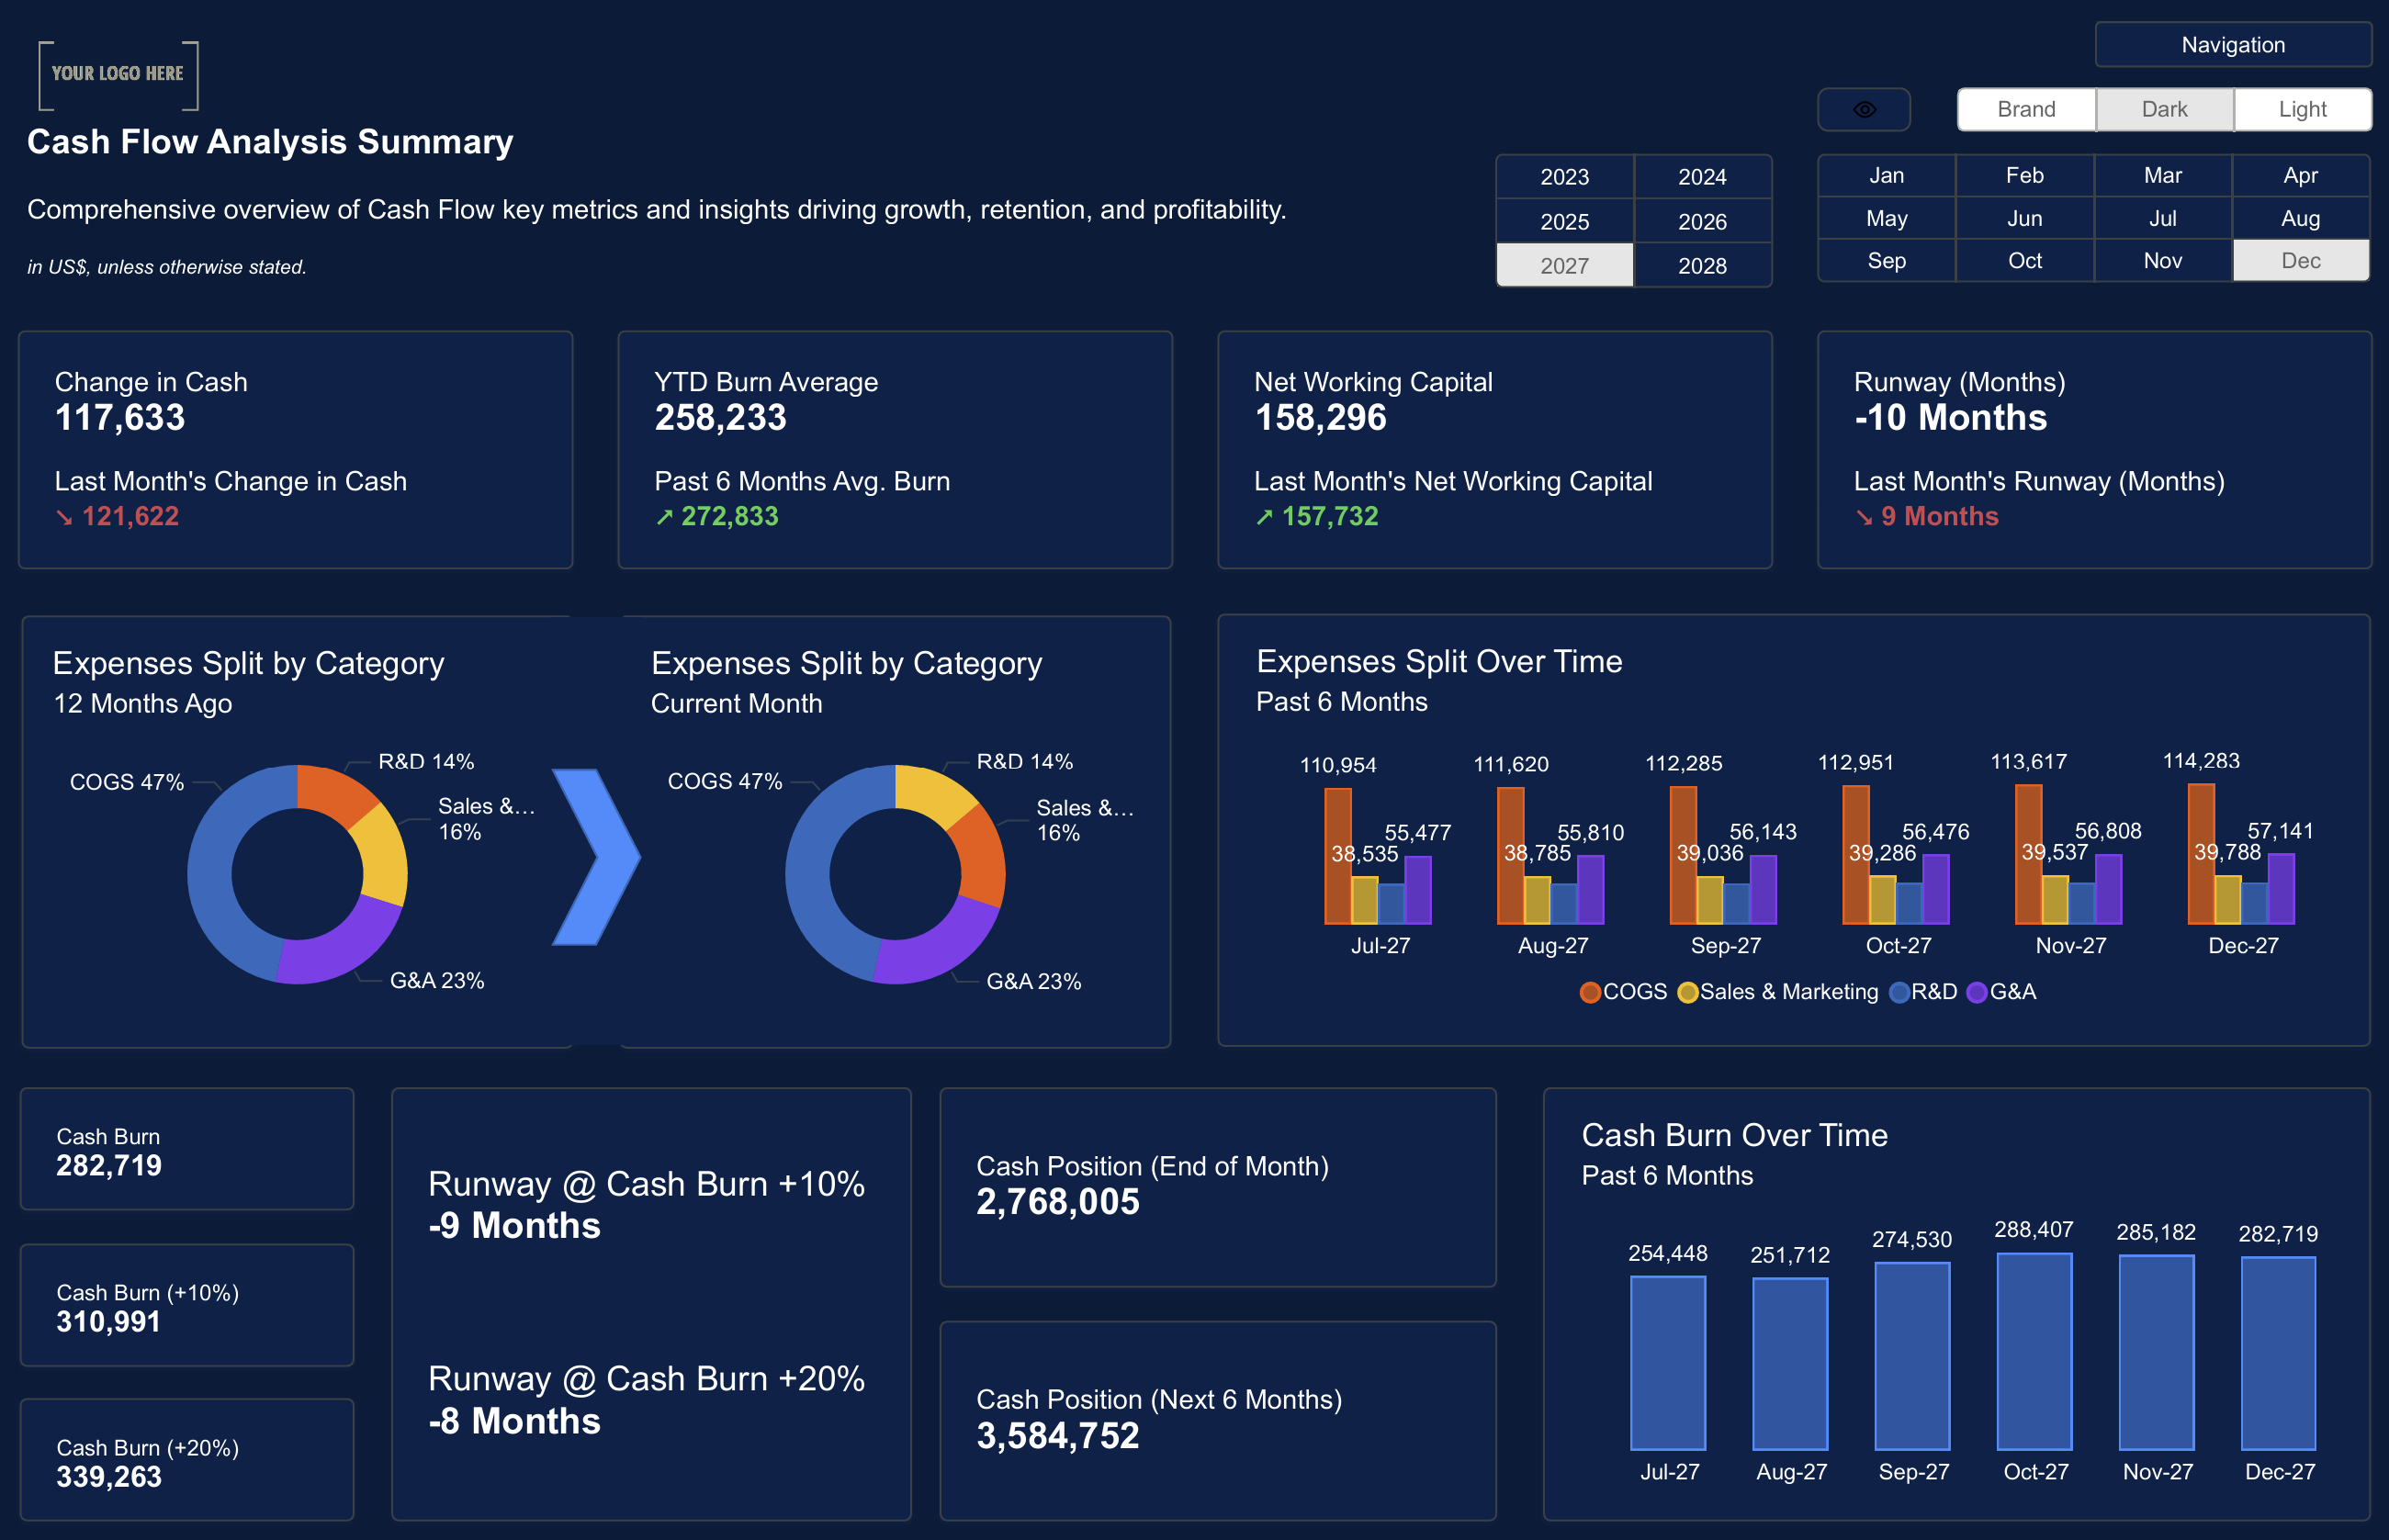
Cash Flow Analysis Dashboard Templates (Light & Dark Mode)
When tracking cash flow, both Light Mode and Dark Mode dashboards provide clear insights into inflows, outflows, and net cash position.
The Dark Mode version can help reduce eye strain, while the Light Mode version offers traditional clarity for reviewing financial data.
Which Mode Should You Use?
The choice between Light Mode and Dark Mode dashboards ultimately depends on your team’s preferences and working environment. Both versions provide the same key insights, but the visual experience can vary.
Consider using:
- Light Mode for traditional office settings.
- Dark Mode for long working hours or remote work environments.
 The Impact of Dark Mode Dashboards in Power BI
Power BI dashboards are essential for business growth, and choosing between Light Mode and Dark Mode can impact your team's data interpretation.
Ready to explore both versions? Download our Power BI templates and see which one suits your needs best.
Download the Power BI Dashboard Templates now and take your business reporting to the next level.Get Started >
Subscribe to our newsletter
Stay ahead with the latest insights, tips, and trends in PowerBI and data visualization.
Join the network that is unlocking the full potential of their data - one dashboard at a time.
Related posts
Explore more insights and tips with these related posts curated just for you.

Why Power BI Reporting Dashboards Are Key to Scaling Small Businesses?

Power BI Dashboard Examples: Essential Design Patterns That Users Love [2025 Guide]