
Stunning Power BI Dashboard Examples to Inspire Your Data Storytelling
In today's data-driven world, businesses are drowning in information but starving for wisdom. The key to transforming raw data into actionable insights lies in effective data visualization. Microsoft Power BI stands out as a leading business analytics service, enabling users to create interactive and compelling dashboards. But what makes a Power BI dashboard truly effective? Seeing is believing. That's why we've curated a collection of impactful Power BI dashboard examples to spark your imagination and demonstrate how you can unlock powerful business insights. Whether you're in sales, marketing, finance, HR, or operations, these examples will show you the art of the possible.
Supercharging Sales with Dynamic Power BI Dashboard Examples
Effective sales management hinges on real-time visibility into performance. Power BI dashboard examples for sales teams typically focus on key performance indicators (KPIs) that drive revenue and growth. Imagine a dashboard showcasing:
- Sales Performance Overview: Visualizing total revenue, year-over-year growth, actuals vs. targets, and sales by region or product. Interactive maps and bar charts make this data instantly digestible.
- Sales Funnel Analysis: Tracking leads through each stage of the pipeline, from initial contact to closed deal. This helps identify bottlenecks and conversion rates.
- Individual & Team Performance: Leaderboards, individual quota attainment, and activity metrics empower sales managers to coach effectively and motivate their teams.
These Power BI dashboard examples allow sales leaders to quickly identify top performers, lagging areas, and opportunities for improvement, turning data into decisive action.
 Power BI Dashboard
Optimizing Marketing ROI with Insightful Power BI Dashboard Examples
Marketing departments juggle numerous campaigns across various channels. Power BI dashboard examples for marketing provide a unified view of campaign effectiveness and return on investment (ROI). Consider these examples:
- Campaign Performance Tracker: Consolidating data from Google Analytics, social media platforms, and email marketing tools to show website traffic, lead generation, conversion rates, and cost per acquisition for each campaign.
- Website Analytics Dashboard: Diving deep into website visitor behavior, including page views, bounce rates, session duration, and traffic sources, helping to optimize user experience and content strategy.
- Social Media Engagement: Visualizing follower growth, engagement rates, reach, and sentiment across different platforms to refine social media strategies.
By leveraging such Power BI dashboard examples, marketers can make data-backed decisions to allocate budgets more effectively and maximize their impact.

Gaining Financial Clarity with Comprehensive Power BI Dashboard Examples
Financial health is the bedrock of any successful business. Power BI dashboard examples for finance offer clear, concise, and real-time views of a company's financial standing. Key financial dashboards often include:
- Profit and Loss (P&L) Statement Summary: Interactive charts displaying revenue, cost of goods sold (COGS), operating expenses, and net profit over time, often with drill-down capabilities into specific accounts.
- Cash Flow Management: Tracking cash inflows and outflows, projecting future cash positions, and highlighting potential shortfalls or surpluses.
- Budget vs. Actuals Analysis: Comparing planned expenditure and revenue against actual performance, allowing for timely adjustments and better forecasting.
These Power BI dashboard examples empower finance professionals and executives to monitor fiscal health, identify trends, and make informed strategic financial decisions.
Enhancing HR Strategy with People-Centric Power BI Dashboard Examples
An organization's greatest asset is its people. Power BI dashboard examples for Human Resources (HR) provide crucial insights into workforce analytics, helping to optimize talent management and employee engagement. Useful HR dashboards might feature:
- Workforce Demographics & Diversity: Visualizing employee distribution by age, gender, department, location, and other diversity metrics to support inclusivity initiatives.
- Recruitment Funnel & Efficiency: Tracking applicants through the hiring process, time-to-hire, cost-per-hire, and source effectiveness.
- Employee Turnover & Retention: Analyzing attrition rates, identifying reasons for departure, and monitoring employee satisfaction scores to improve retention strategies.
These Power BI dashboard examples enable HR leaders to proactively address workforce challenges, foster a positive work environment, and align HR strategies with business objectives.
Streamlining Operations with Efficient Power BI Dashboard Examples
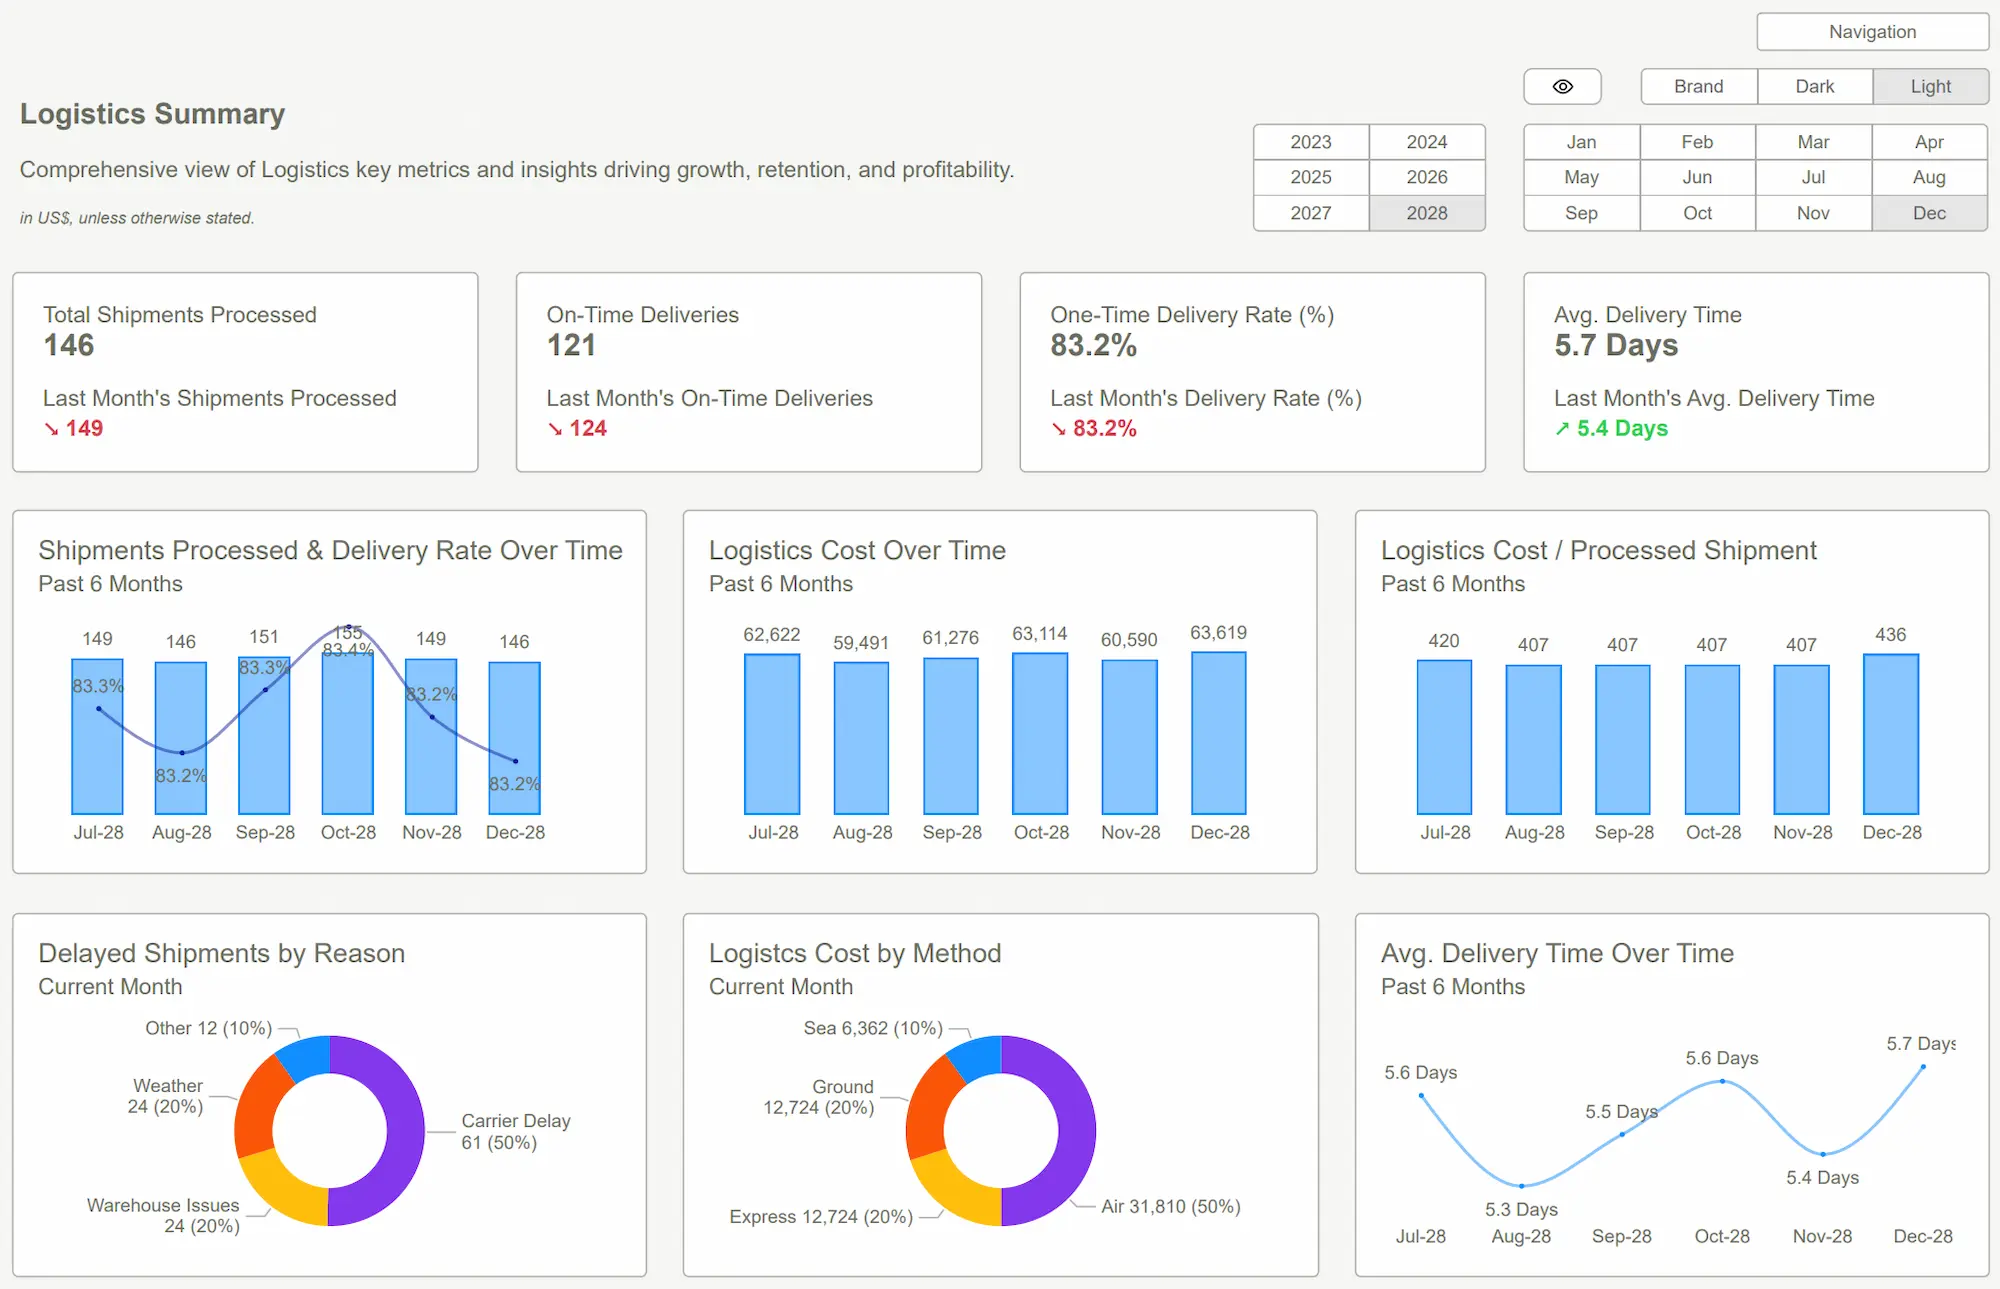
Operational efficiency is key to profitability and customer satisfaction. Power BI dashboard examples for operations and supply chain management help businesses monitor processes, identify inefficiencies, and optimize performance. Look for dashboards that include:
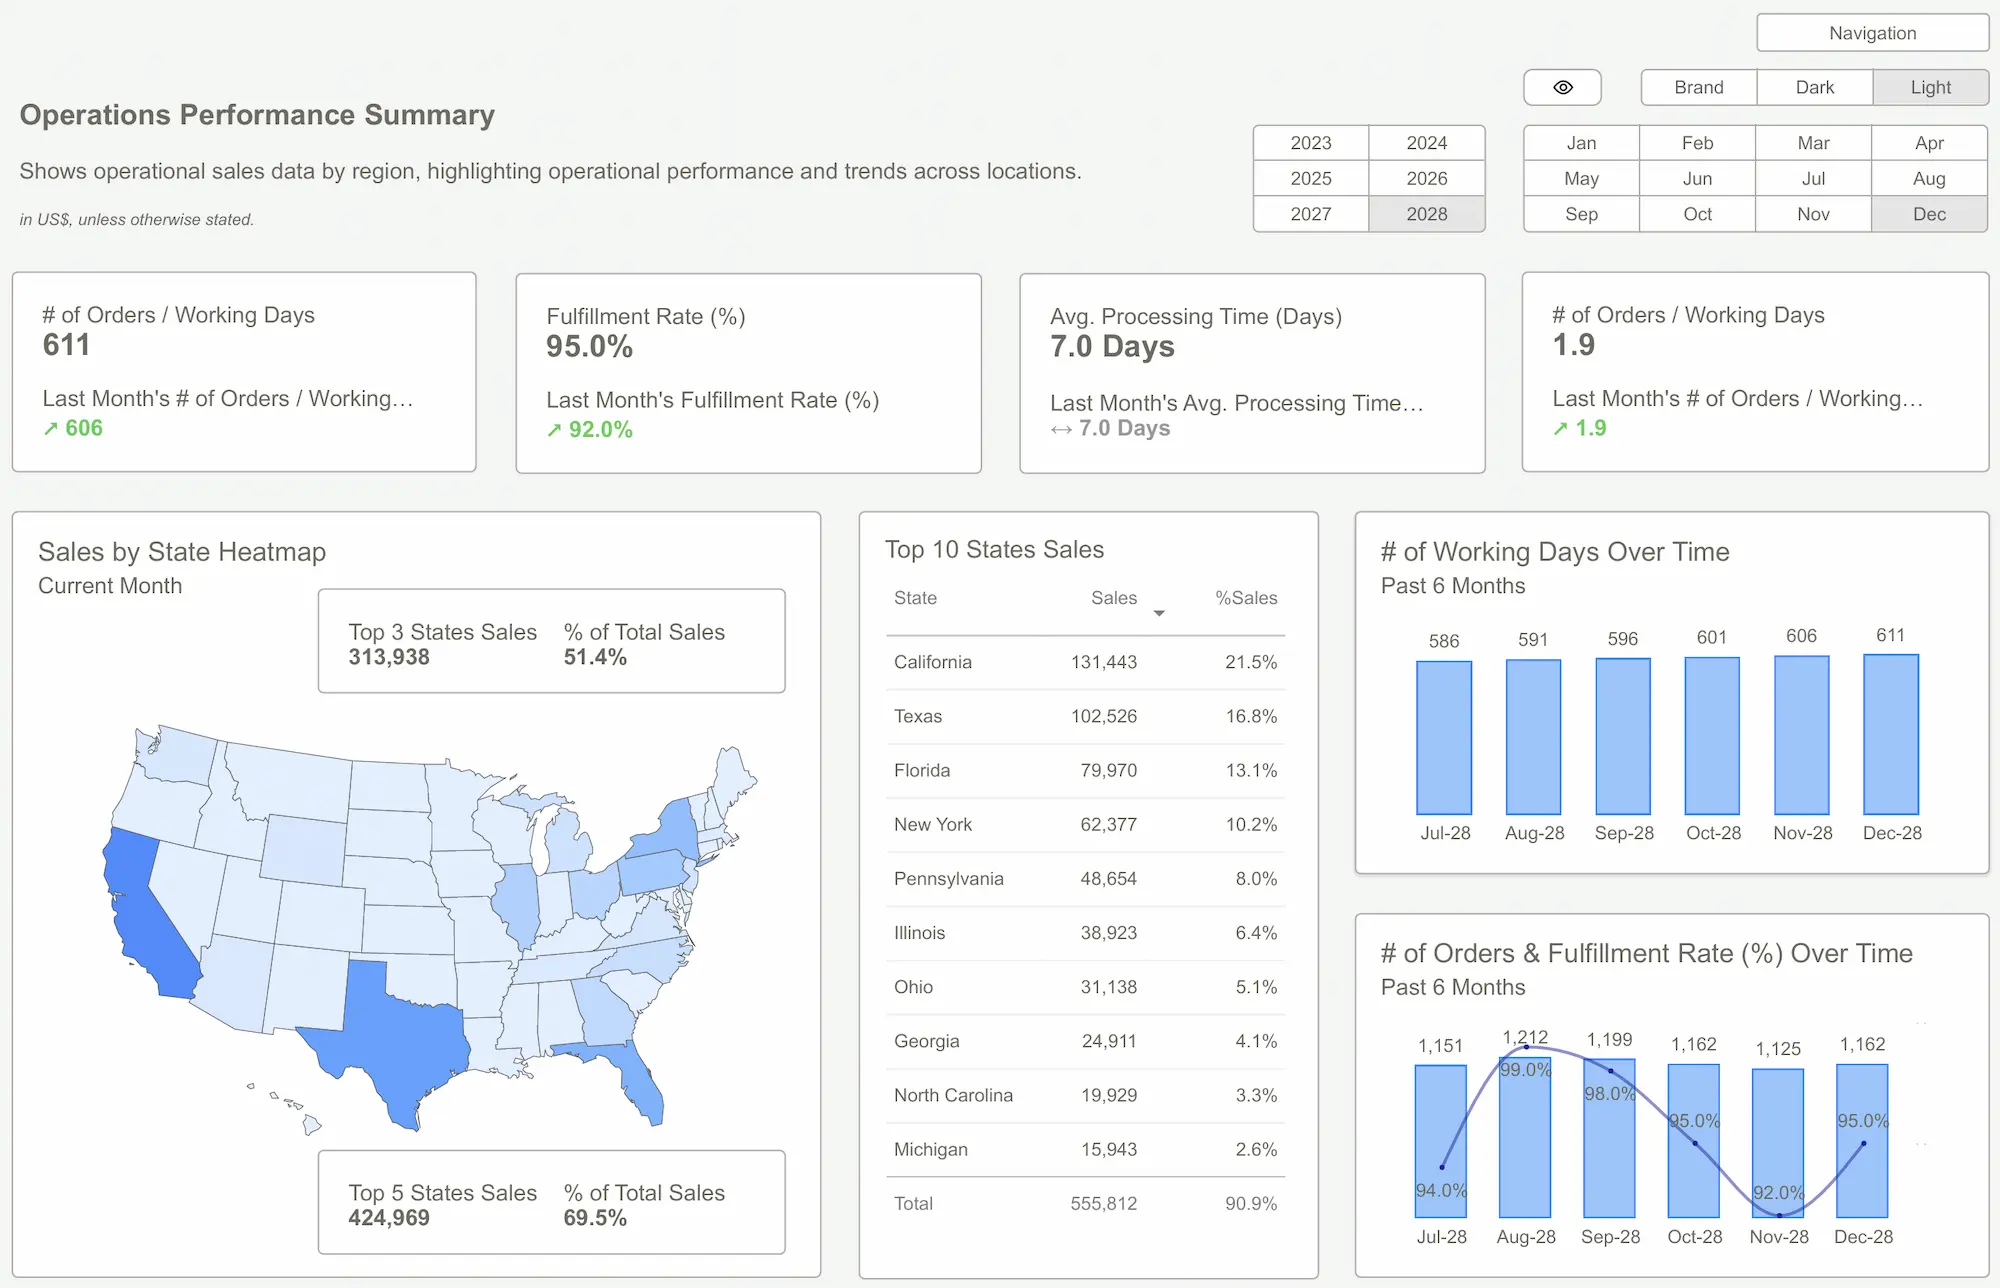
- Supply Chain Management: Tracking inventory levels, supplier performance, order fulfillment rates, and logistics costs to ensure a smooth flow of goods.
- Manufacturing Performance: Monitoring production output, equipment uptime (OEE), defect rates, and cycle times to improve manufacturing processes.
- Project Management Overview: Visualizing project timelines, resource allocation, budget adherence, and milestone completion for multiple projects.
Utilizing these types of Power BI dashboard examples gives operations managers the visibility needed to reduce costs, improve quality, and enhance overall operational effectiveness.
 Power BI Templates
The Power BI dashboard examples highlighted above are just a glimpse into the transformative power of data visualization.
The true strength of Power BI lies in its flexibility, allowing you to tailor dashboards to your specific business needs, data sources, and KPIs. By drawing inspiration from these examples, you can move beyond static reports and create dynamic, interactive dashboards that empower your teams to make smarter, faster decisions.
Start exploring the potential of Power BI today and turn your data into your most valuable asset.
Ready to harness the power of your data with custom Power BI dashboards?Get Started >
Subscribe to our newsletter
Stay ahead with the latest insights, tips, and trends in PowerBI and data visualization.
Join the network that is unlocking the full potential of their data - one dashboard at a time.
Related posts
Explore more insights and tips with these related posts curated just for you.

Mastering the Power BI Dashboard: Essential Tips for Effective Design

Why Power BI Reporting Dashboards Are Key to Scaling Small Businesses?
