
Power BI is a powerful tool for creating interactive reports that provide actionable insights. However, designing a report from scratch can be overwhelming. That’s where Power BI templates come in.
In this guide, we’ll explore how to create stunning Power BI reports using pre-built templates for finance, sales, marketing, and operations, so you can save time and focus on making better decisions.
Finance Report Template
The Finance Report Template is essential for tracking your company’s financial health. It helps finance teams monitor revenue, expenses, and cash flow in real time.
Key Metrics Tracked in the Finance Report:
- Monthly and yearly revenue
- Expense tracking by category
- Profit margins
- Cash flow projections
Using this template, finance teams can quickly identify financial risks and opportunities to improve profitability.
 Power BI Data Modeling: Best Practices
Sales Report Template
The Sales Report Template allows sales teams to track performance metrics and revenue growth. With this template, you can monitor the entire sales pipeline, from leads to closed deals.
Key Metrics Tracked in the Sales Report:
- Sales pipeline status
- Revenue by product or service
- Conversion rates
- Customer acquisition cost
This template helps sales managers make data-driven decisions and improve the team’s performance.

Marketing Report Template
Marketing teams can use the Marketing Report Template to track campaign performance and measure ROI. This template provides insights into customer engagement and conversion rates, allowing marketers to optimize their strategies.
Key Metrics Tracked in the Marketing Report:
- Campaign ROI
- Click-through rates (CTR)
- Lead conversion rates
- Cost per lead
With this template, marketers can make real-time adjustments to improve campaign performance.
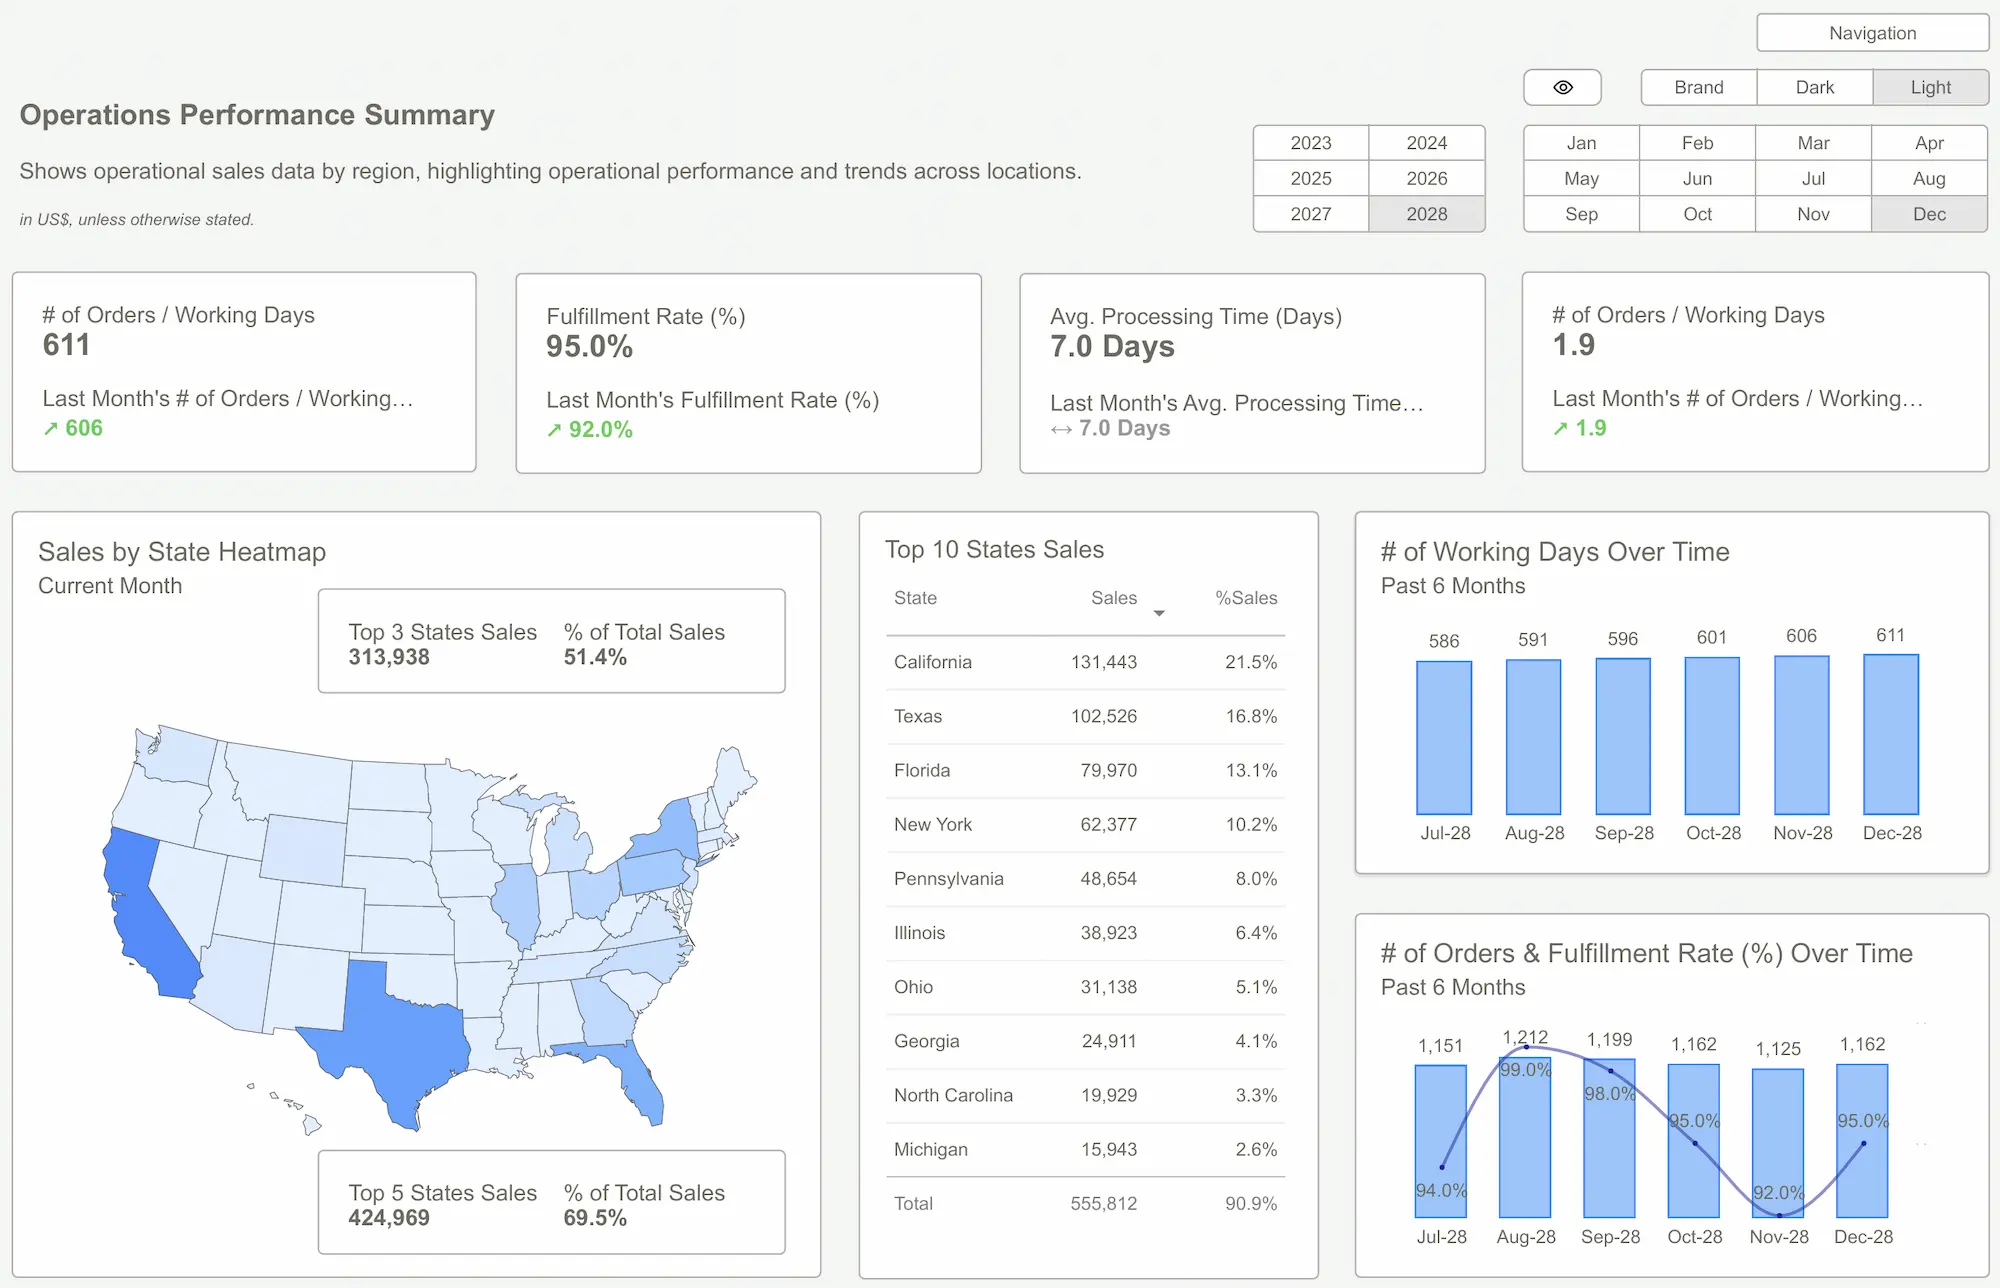
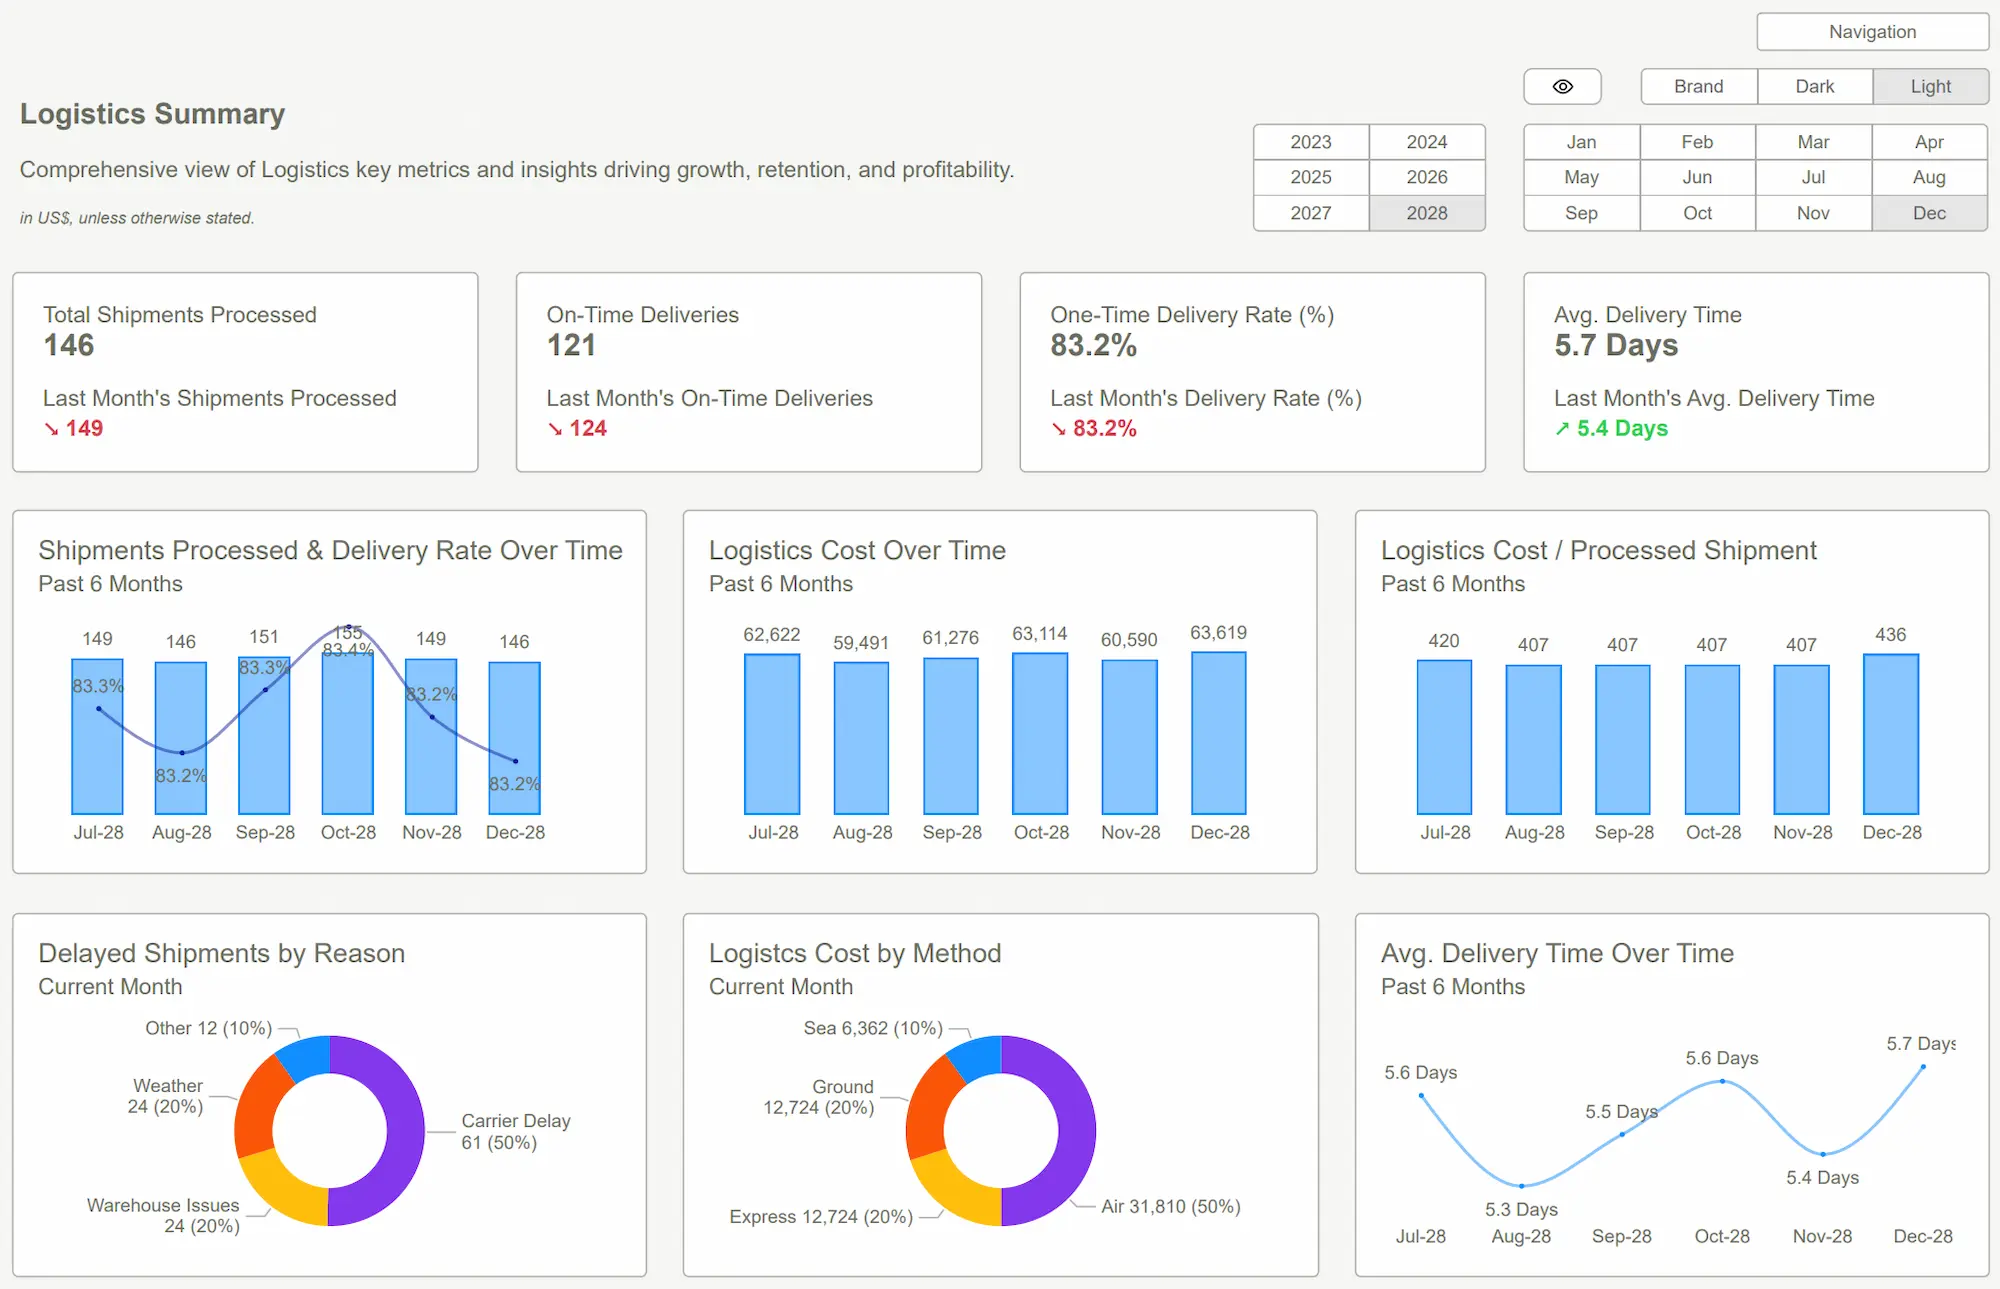
Operations Report Template
The Operations Report Template helps track workflows, task completion rates, and department productivity. It’s essential for optimizing your company’s day-to-day processes.
Key Metrics Tracked in the Operations Report:
- Task completion rates
- Workflow timelines
- Productivity by department
- Key performance indicators (KPIs)
This template enables businesses to streamline operations and identify bottlenecks that could slow down performance.
Project Report Template
The Project Report Template is perfect for tracking task progress, timelines, and budgets. It helps project managers stay on top of their projects and ensure deadlines are met.
Key Metrics Tracked in the Project Report:
- Task completion status
- Project timelines
- Resource allocation
- Budget tracking
With this template, project managers can reduce risks and ensure project success.
 Power BI Templates – Boost Your Business Reporting
Creating stunning Power BI reports doesn’t have to be complicated. By using pre-built templates for finance, sales, marketing, operations, and project management, you can save time and focus on making data-driven decisions.
Download the Power BI Report Templates now and create stunning dashboards for your business.Get Started >
Subscribe to our newsletter
Stay ahead with the latest insights, tips, and trends in PowerBI and data visualization.
Join the network that is unlocking the full potential of their data - one dashboard at a time.
Related posts
Explore more insights and tips with these related posts curated just for you.
Top 10 Power BI Dashboard Examples to Boost Business Insights

Mastering the Power BI Dashboard: Essential Tips for Effective Design
