
Power BI templates are a game-changer for businesses looking to improve their reporting efficiency. Instead of building dashboards from scratch, these ready-to-use templates allow you to focus on making data-driven decisions faster.
In this article, we’ll explore five essential Power BI templates for business reporting, covering key areas such as operations, sales, performance marketing, human resources, and cash flow analysis.
Operations Dashboard Template
The Operations Dashboard Template is designed to help businesses track key workflows and performance metrics in real-time. It allows teams to optimize processes, reduce bottlenecks, and improve overall efficiency.
Key Metrics Tracked in the Operations Dashboard:
- Task completion rates
- Workflow timelines
- Department productivity metrics
- Key performance indicators (KPIs) for operations
By using this template, businesses can make informed decisions to improve their day-to-day operations.

Sales Dashboard Template
The Sales Dashboard Template is essential for sales teams to track their performance and identify revenue opportunities. With real-time insights, sales managers can adjust strategies and focus on the right prospects.
Key Metrics Tracked in the Sales Dashboard:
- Monthly and yearly sales performance
- Revenue by product or service
- Conversion rates
- Customer acquisition metrics
This dashboard helps businesses boost sales performance and ensure that revenue goals are met.

Performance Marketing Dashboard Template
Marketing teams need to track the performance of their campaigns to ensure they’re getting a good return on investment (ROI). The Performance Marketing Dashboard Template helps visualize key metrics and adjust strategies accordingly.
Key Metrics Tracked in the Marketing Dashboard:
- Campaign ROI
- Cost per acquisition (CPA)
- Click-through rates (CTR)
- Conversion rates
With this dashboard, marketers can make data-driven adjustments to improve campaign performance.

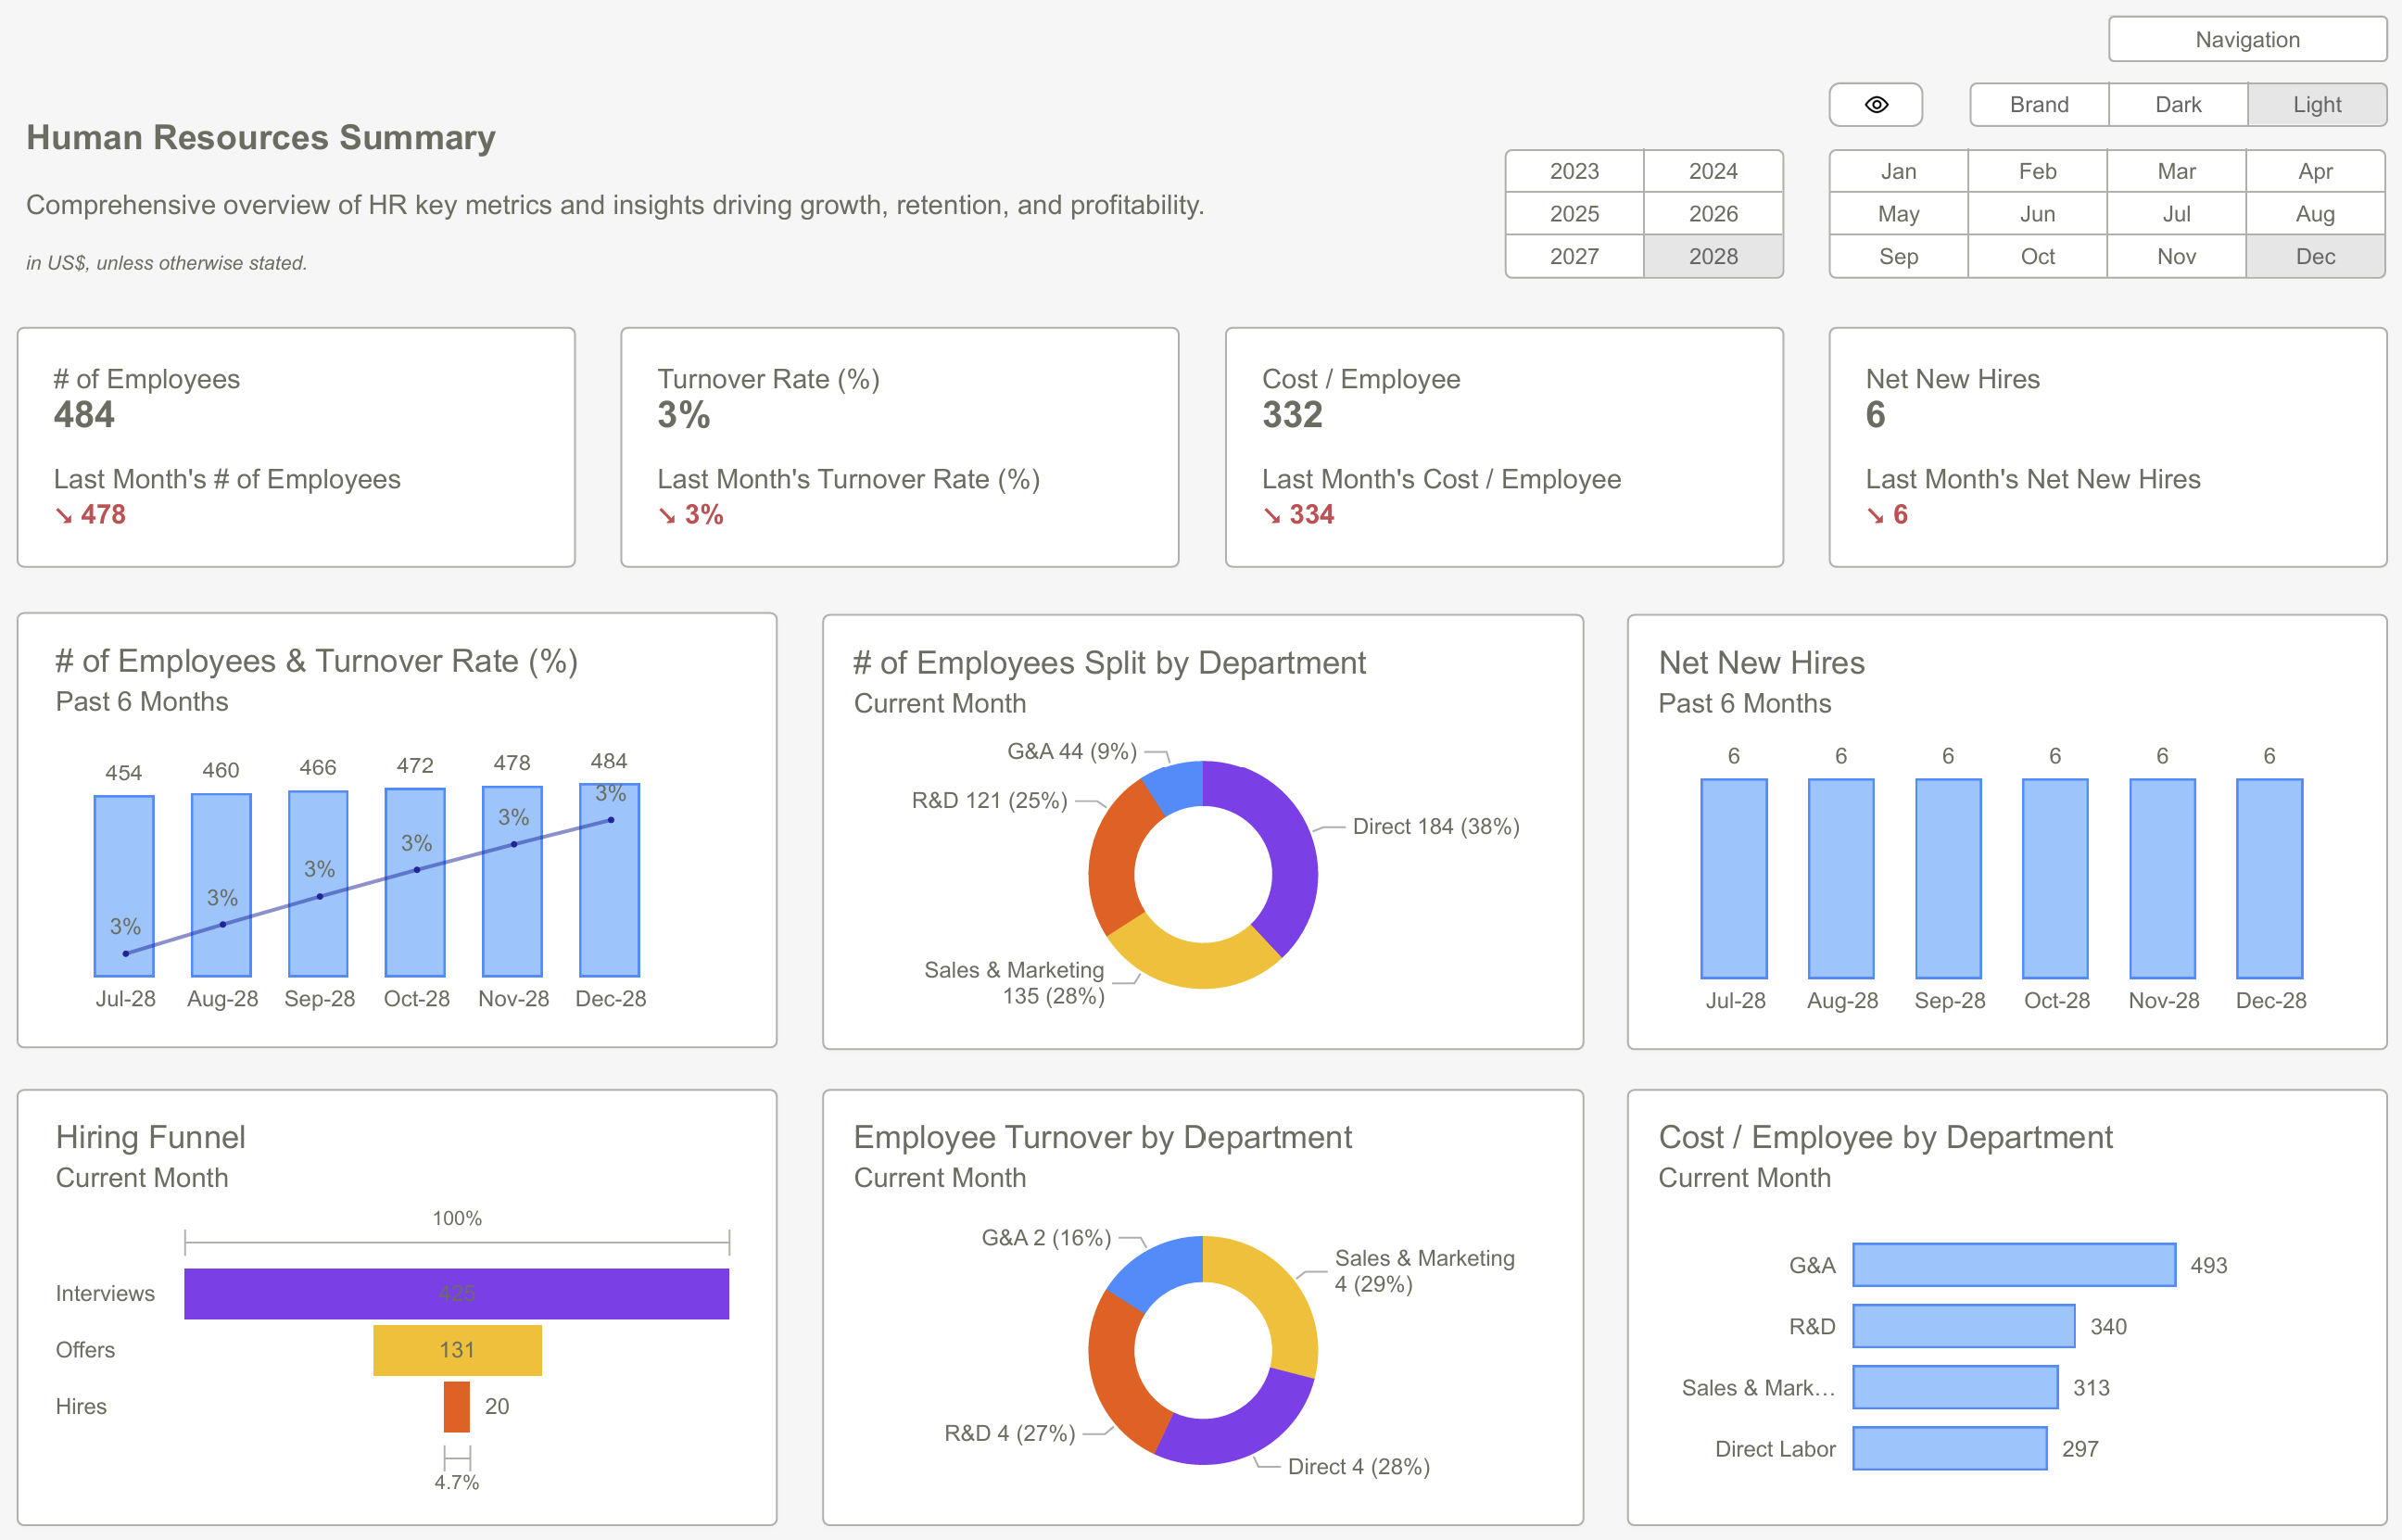
Human Resources Dashboard Template
The Human Resources (HR) Dashboard Template is a powerful tool for monitoring employee performance, attendance, and overall HR metrics. It provides a comprehensive view of your workforce and helps HR teams identify trends.
Key Metrics Tracked in the HR Dashboard:
- Employee attendance rates
- Performance evaluations
- Turnover rates
- Employee satisfaction scores
This template enables HR managers to improve employee engagement and retain top talent.
Cash Flow Analysis Dashboard Template
Cash flow management is critical for any business. The Cash Flow Analysis Dashboard Template in Power BI provides a clear picture of your company's financial health, helping you track cash inflows, outflows, and overall liquidity.
Key Metrics Tracked in the Cash Flow Dashboard:
- Cash inflows by source
- Cash outflows by category
- Net cash position over time
- Projected cash flow
With this dashboard, businesses can ensure they maintain a healthy cash flow and avoid liquidity issues.
 Essential KPIs in Finance for Power BI Dashboards
Power BI templates are essential for businesses looking to improve their reporting efficiency. By using pre-built dashboards for operations, sales, marketing, HR, and cash flow, you can make data-driven decisions faster and more effectively.
Ready to get started? Download our Power BI templates today and take your business reporting to the next level!
Download the Power BI Templates now and streamline your business reporting with professional dashboards.Get Started >
Subscribe to our newsletter
Stay ahead with the latest insights, tips, and trends in PowerBI and data visualization.
Join the network that is unlocking the full potential of their data - one dashboard at a time.
Related posts
Explore more insights and tips with these related posts curated just for you.

Why Power BI Reporting Dashboards Are Key to Scaling Small Businesses?

Power BI Dashboard Examples: Essential Design Patterns That Users Love [2025 Guide]