Let’s get real: you didn’t become a data professional or manager to spend your days fiddling with alignment boxes, debugging DAX formulas, or deciding whether cornflower or cobalt blue best screams “Q3 earnings.” But here you are, elbows-deep in another “simple” Power BI dashboard that’s chewing up your calendar and your will to live.
Sound familiar?
There’s a better way. Power BI Templates aren’t just a shortcut—they’re a full-blown time machine. Instead of starting from zero every time a stakeholder screams for “insights by EOD,” imagine plugging in your data and producing polished, executive-ready dashboards in minutes.
In this article, we’ll show you how Power BI Templates can help you save hours (or days), dodge common mistakes, and finally get back to the work that actually matters: delivering insight, not just charts.
The Dashboard Time Sink That’s Killing Your Productivity
We’ve all been there. You get a simple request: “Can we have a quick dashboard on sales trends?” Fast-forward 18 hours and you’re still untangling relationships, wrestling slicers, and watching Power BI load like it’s on dial-up. What happened?
Here’s the truth: Building dashboards from scratch is a massive time suck. Especially when you’re doing it all—designing the layout, choosing visuals, writing DAX, and validating KPIs. That’s four jobs, and unless you moonlight as a BI agency, you’re not paid for all of them.
Worse, most DIY dashboards fall into the same traps:
- 🕳 Overdesigned or under-thought: Pretty? Maybe. Insightful? Not so much.
- 🧩 DAX disasters: One wrong CALCULATE and it’s garbage in, garbage out.
- 🔄 The “Update Hell” loop: Every data refresh breaks something. Every. Time.
This isn’t just frustrating—it’s career-limiting. Your time should be spent on insights, strategy, and helping your org make smarter decisions—not googling how to fix an invalid visual.
 Power BI Templates
Templates: Your Fast Pass to Power BI Greatness
Imagine opening a Power BI file where the hard stuff—design, structure, DAX, even best-practice KPIs—is already done. All you need to do is connect your data. That’s the power of a professional Power BI Template.
It’s like getting a pre-built Tesla when you were about to weld your own bicycle.
Here’s what you get when you use a Power BI Template from Power BI Kit:
- ⚡ Time savings: Skip the grunt work. Templates save 20–40 hours per dashboard, easily.
- 🎯 Accuracy by design: Pre-built DAX measures, optimized models, and filters that actually work.
- 🎨 Design that communicates: Visual hierarchy, color theory, and layout done by pros who live this stuff.
- 🛠️ Easy customization: Swap logos, match brand colors, tweak visuals—all without breaking the core structure.
And before you say, “But my data is unique!”—good templates are built for flexibility. Power BI Kit’s templates are plug-and-play, not paint-by-numbers.
Think of them as 90% done. You bring the last 10% to make it yours.
 How to Make Your First Power BI Dashboard (Step-by-Step)
Why Templates Don’t Just Save Time—They Change the Game
Saving time is nice. But the ripple effects go much further:
- 💡 Better decisions, faster: When you don’t spend two days just building the thing, you have time to actually analyze it.
- 💼 Instant credibility: Templates look like they came from a big-league BI team—even if it’s just you and your laptop.
- 🧠 Strategic headspace: Free up cognitive bandwidth to focus on insights, not interface design.
- 📈 Scalability: Templated dashboards are easier to maintain, reuse, and standardize across teams.
Most importantly, they let you focus on why the numbers matter—not how to get them on the screen. That’s how data professionals level up. That’s how managers stop being reactive and start being strategic.
Let’s face it: You didn’t go into analytics to become a dashboard janitor.
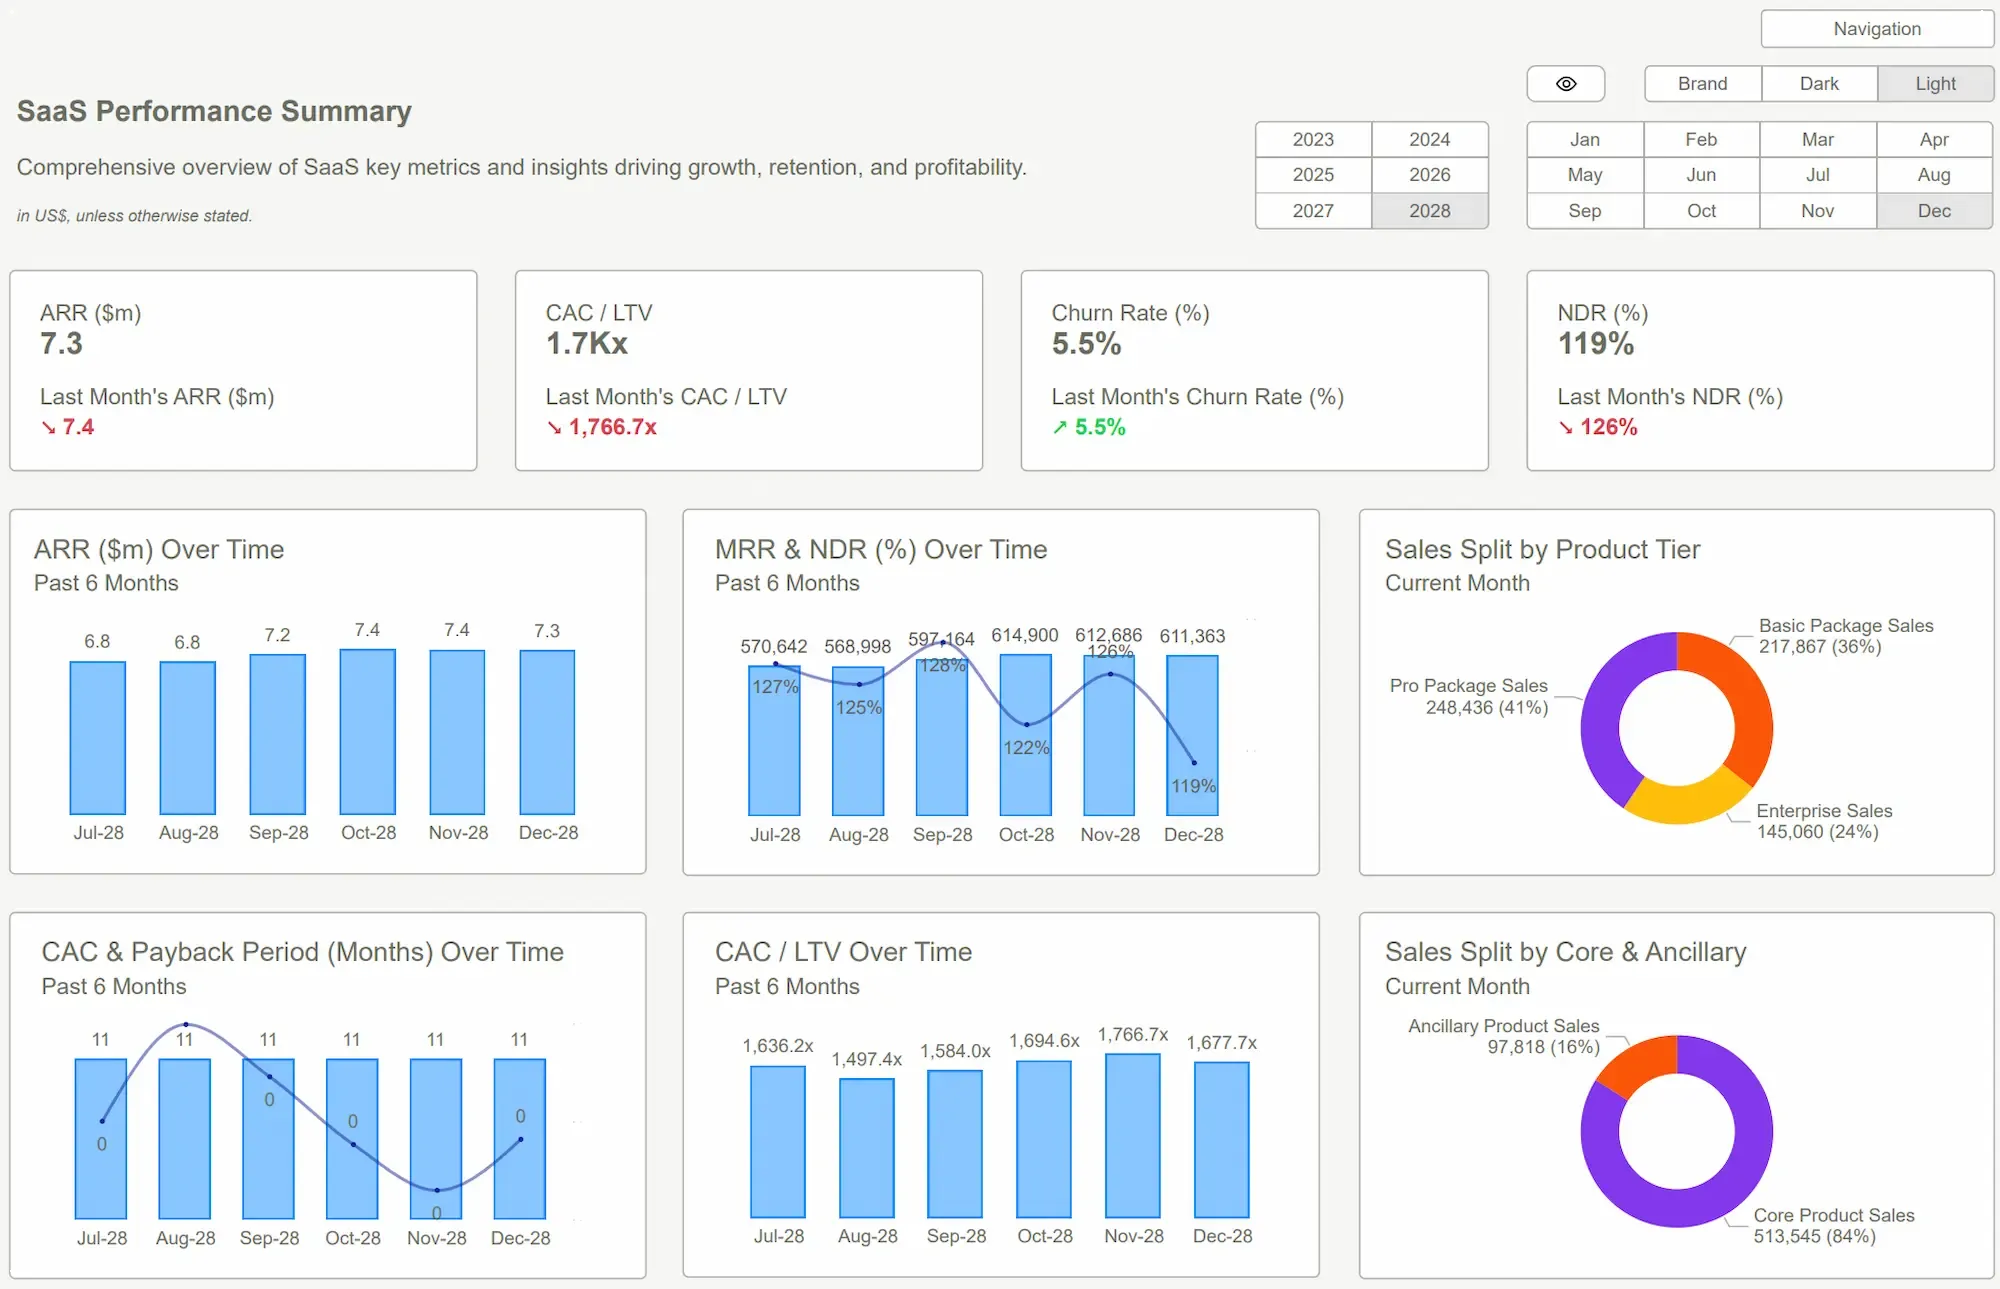
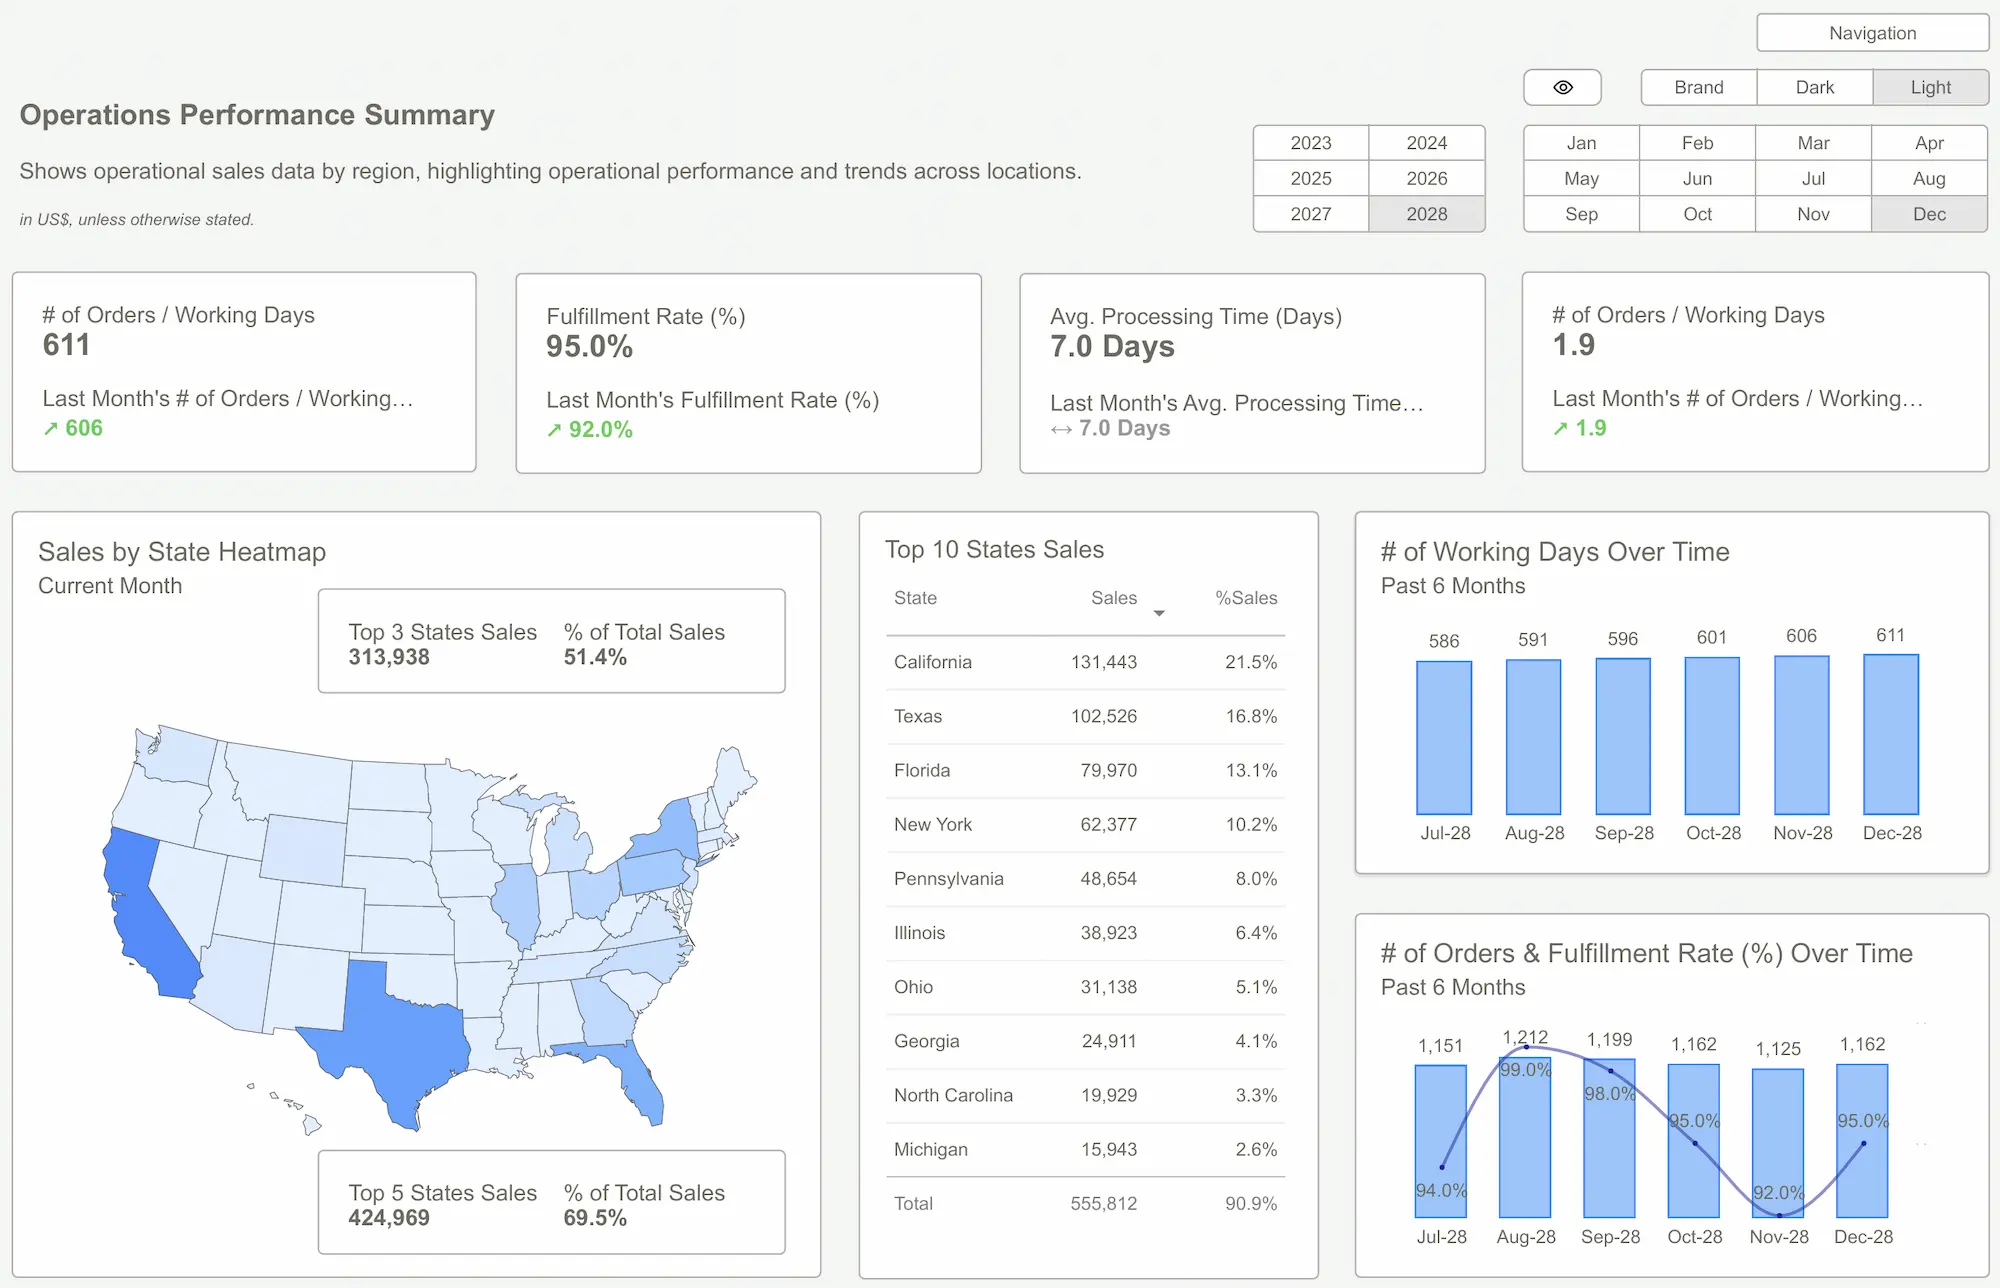
 Power BI Dashboard Examples
If you’re still building dashboards from scratch in 2025, you’re fighting with a wooden sword in a lightsaber duel. The world moves fast, and your stakeholders want insights yesterday.
Power BI Templates from Power BI Kit aren’t just pretty files—they’re tools forged from thousands of hours of expertise. They eliminate setup headaches, accelerate insight delivery, and make you look like the pro who always delivers.
So go ahead. Stop wasting time, stop rebuilding the wheel, and start focusing on what really matters: insights, strategy, and impact.
Explore Power BI Kit Templates → Pricing & Buy NowGet Started >
Subscribe to our newsletter
Stay ahead with the latest insights, tips, and trends in PowerBI and data visualization.
Join the network that is unlocking the full potential of their data - one dashboard at a time.
Related posts
Explore more insights and tips with these related posts curated just for you.

What Makes a Good Power BI Dashboard? Design Principles and Examples

Power BI Dashboard Examples That Save Time, Impress Leadership, and Actually Work