
Power BI templates have transformed the way businesses approach data reporting. By using pre-built templates, you can reduce setup time and focus on making better business decisions.
In this article, we’ll explore five modern Power BI templates for various business functions, available in both Light Mode and Dark Mode to suit your team’s preferences.
Sales Dashboard Template (Light & Dark Mode)
The Sales Dashboard Template is perfect for tracking revenue, conversion rates, and customer acquisition costs. This dashboard is available in both Light Mode and Dark Mode to match your team's preferences.
Key Metrics Tracked:
- Monthly and yearly revenue
- Sales pipeline status
- Conversion rates
- Customer acquisition costs
 How to Create Stunning Power BI Reports Using Templates
Finance Dashboard Template (Light & Dark Mode)
The Finance Dashboard Template helps finance teams monitor cash flow, expenses, and profit margins. The Dark Mode version is especially useful for reducing eye strain during long working hours.
Key Metrics Tracked:
- Cash inflows and outflows
- Expense tracking
- Profit margins
- Monthly revenue trends

Operations Dashboard Template (Dark Mode)
The Dark Mode Operations Dashboard Template provides a sleek, modern design that’s easier on the eyes during long working hours. It displays the same metrics as the Light Mode version but offers a more visually striking interface.
Key Metrics Tracked:
- Task completion rates
- Workflow timelines
- Department productivity metrics

Human Resources Dashboard Template (Dark Mode)
The Human Resources Dashboard Template helps HR managers track employee performance, attendance, and satisfaction scores. The Dark Mode version is especially useful for teams working in low-light environments or during extended hours.
Key Metrics Tracked:
- Employee attendance rates
- Performance evaluations
- Turnover rates
- Employee satisfaction scores

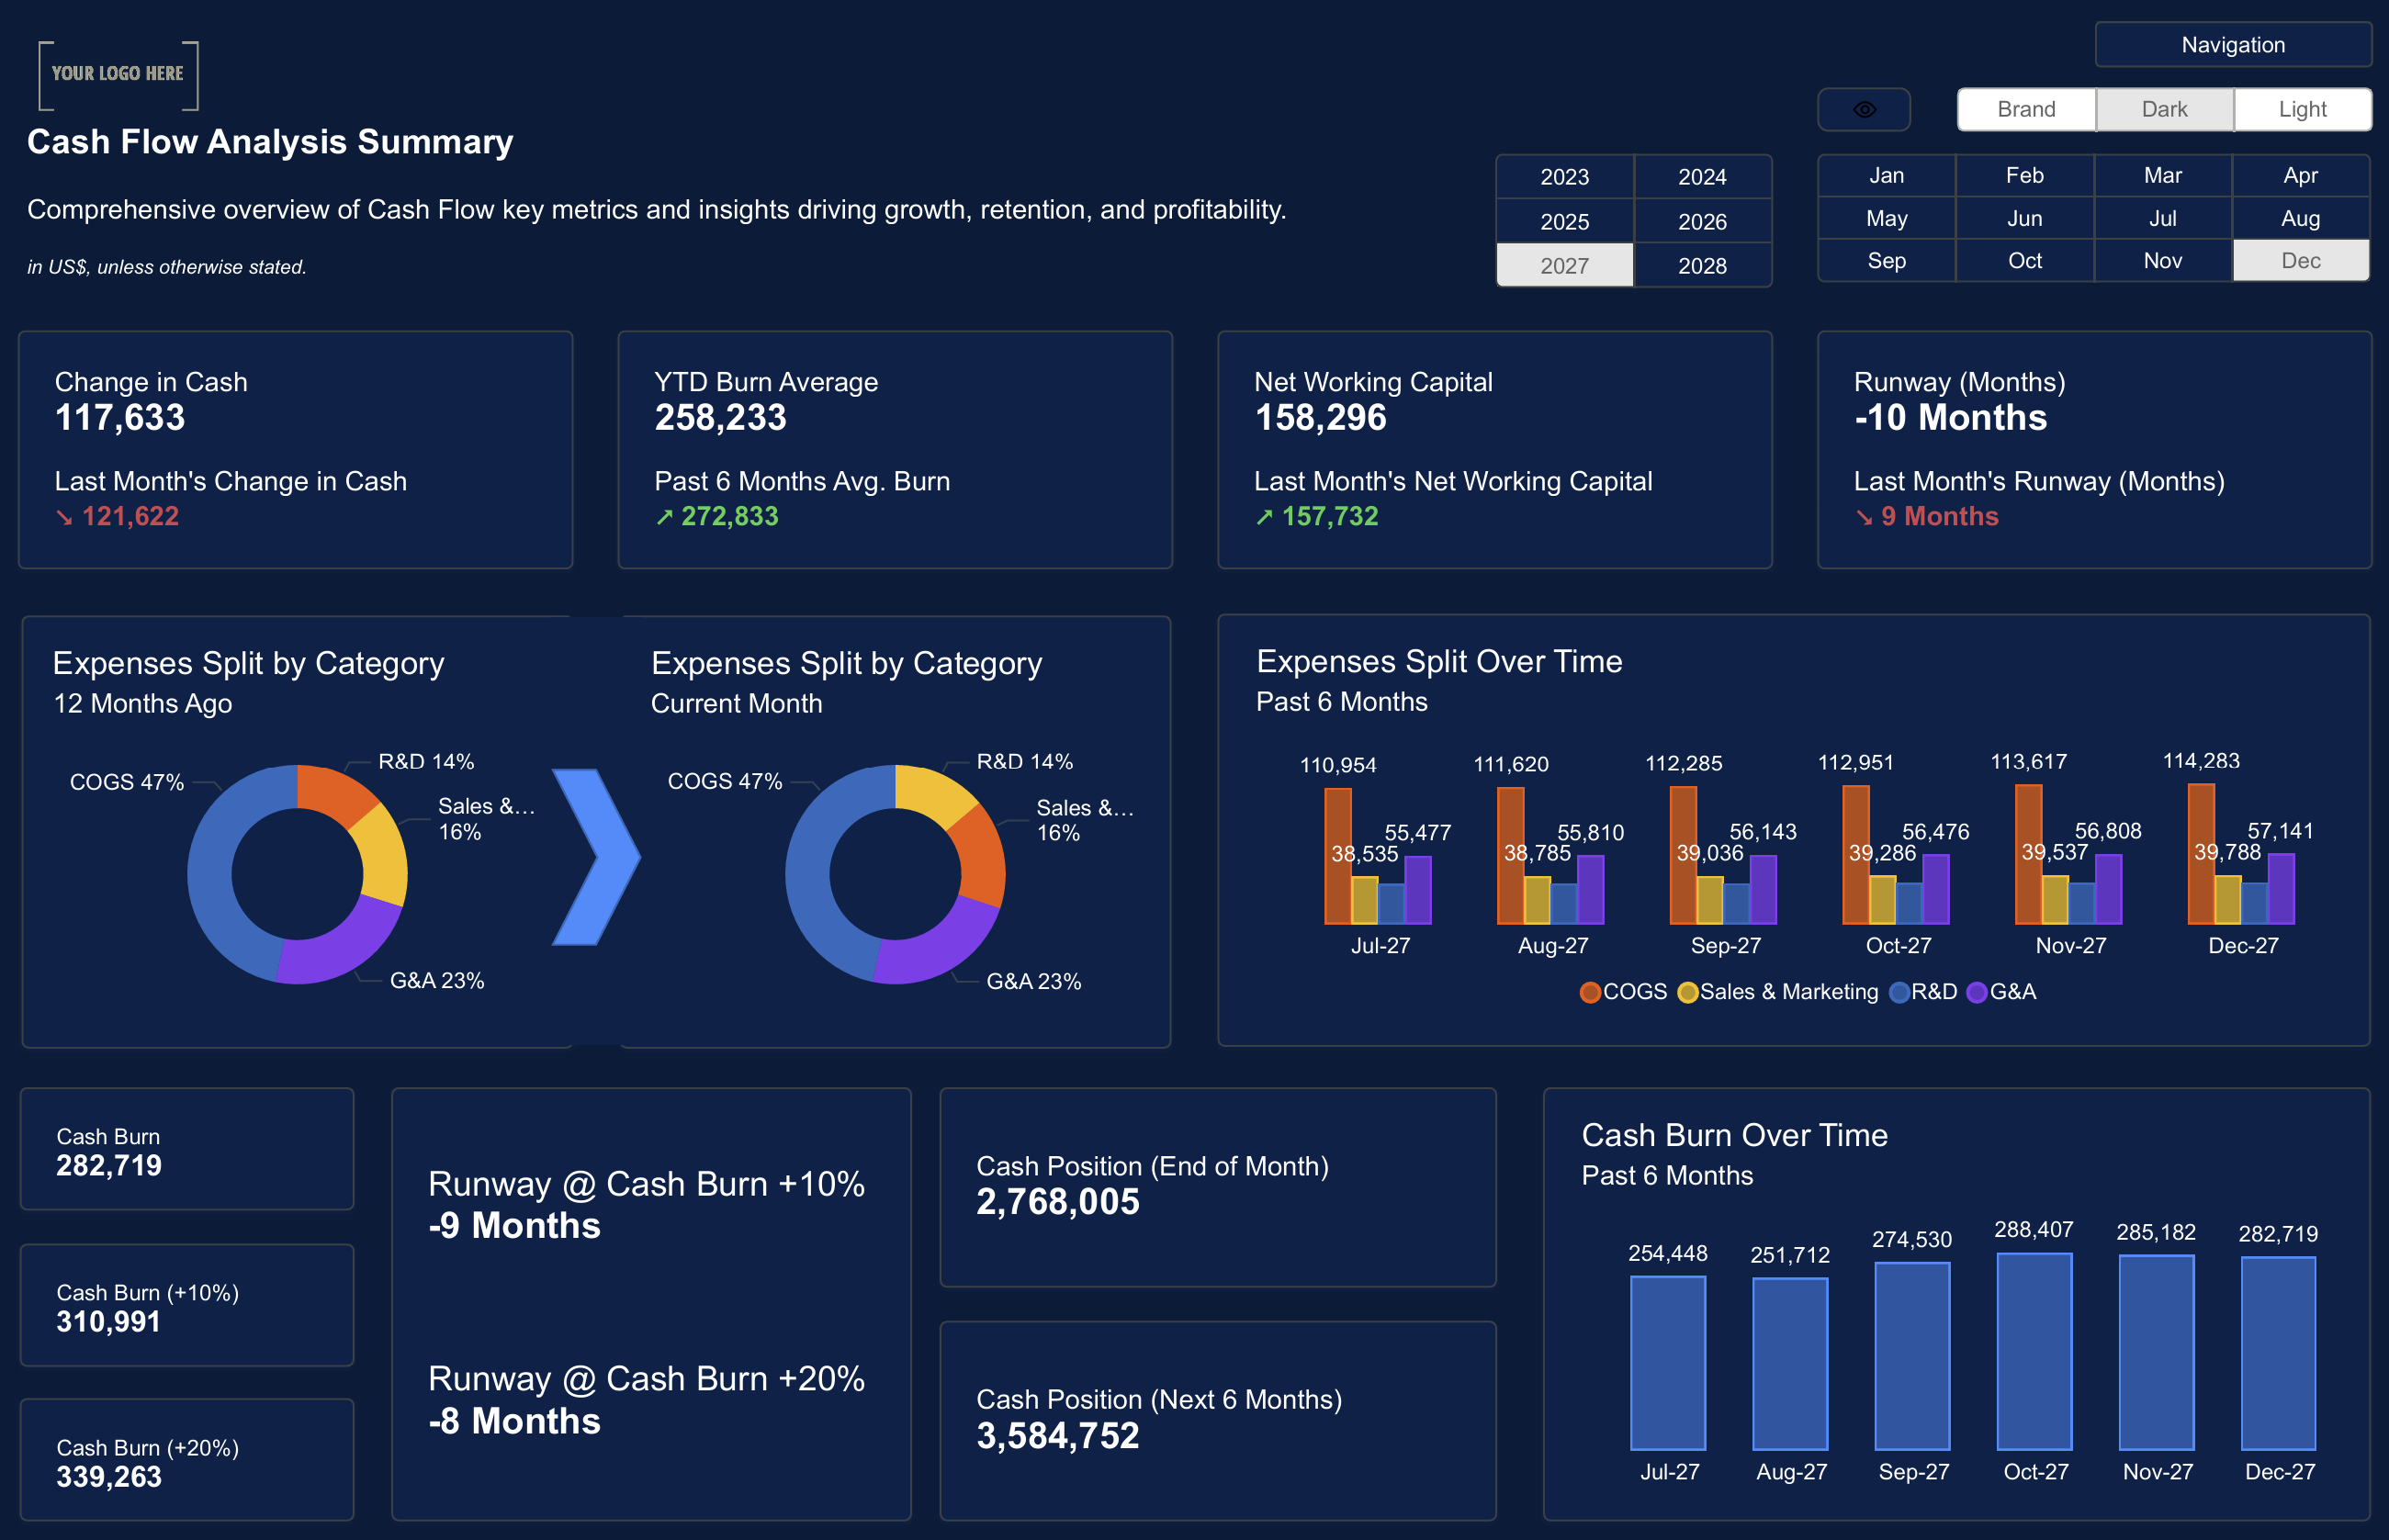
Cash Flow Analysis Dashboard Template (Dark Mode)
The Cash Flow Analysis Dashboard Template in Dark Mode helps businesses track inflows, outflows, and net cash position. The Dark Mode design reduces eye strain and provides a modern look for reviewing financial data.
Key Metrics Tracked:
- Cash inflows by source
- Cash outflows by category
- Net cash position over time
- Projected cash flow
 Top Power BI Templates for Advanced Analytics and Business Insights
Power BI templates can streamline business reporting and help your team make data-driven decisions faster. By choosing between Light Mode and Dark Mode versions, you can improve the visual experience for your team while maintaining the same critical insights.
Download the Power BI Templates now and start improving your business reporting today.Get Started >
Subscribe to our newsletter
Stay ahead with the latest insights, tips, and trends in PowerBI and data visualization.
Join the network that is unlocking the full potential of their data - one dashboard at a time.
Related posts
Explore more insights and tips with these related posts curated just for you.

Why Power BI Reporting Dashboards Are Key to Scaling Small Businesses?

Power BI Dashboard Examples: Essential Design Patterns That Users Love [2025 Guide]