
Building an effective Power BI dashboard starts with a clear understanding of your business needs. Whether you’re managing finances, tracking sales, or analyzing marketing performance, the right dashboard can help you visualize data, improve decision-making, and boost productivity.
In this guide, we’ll share Power BI dashboard ideas for key business functions, along with tips on how to customize templates to fit your organization’s needs.
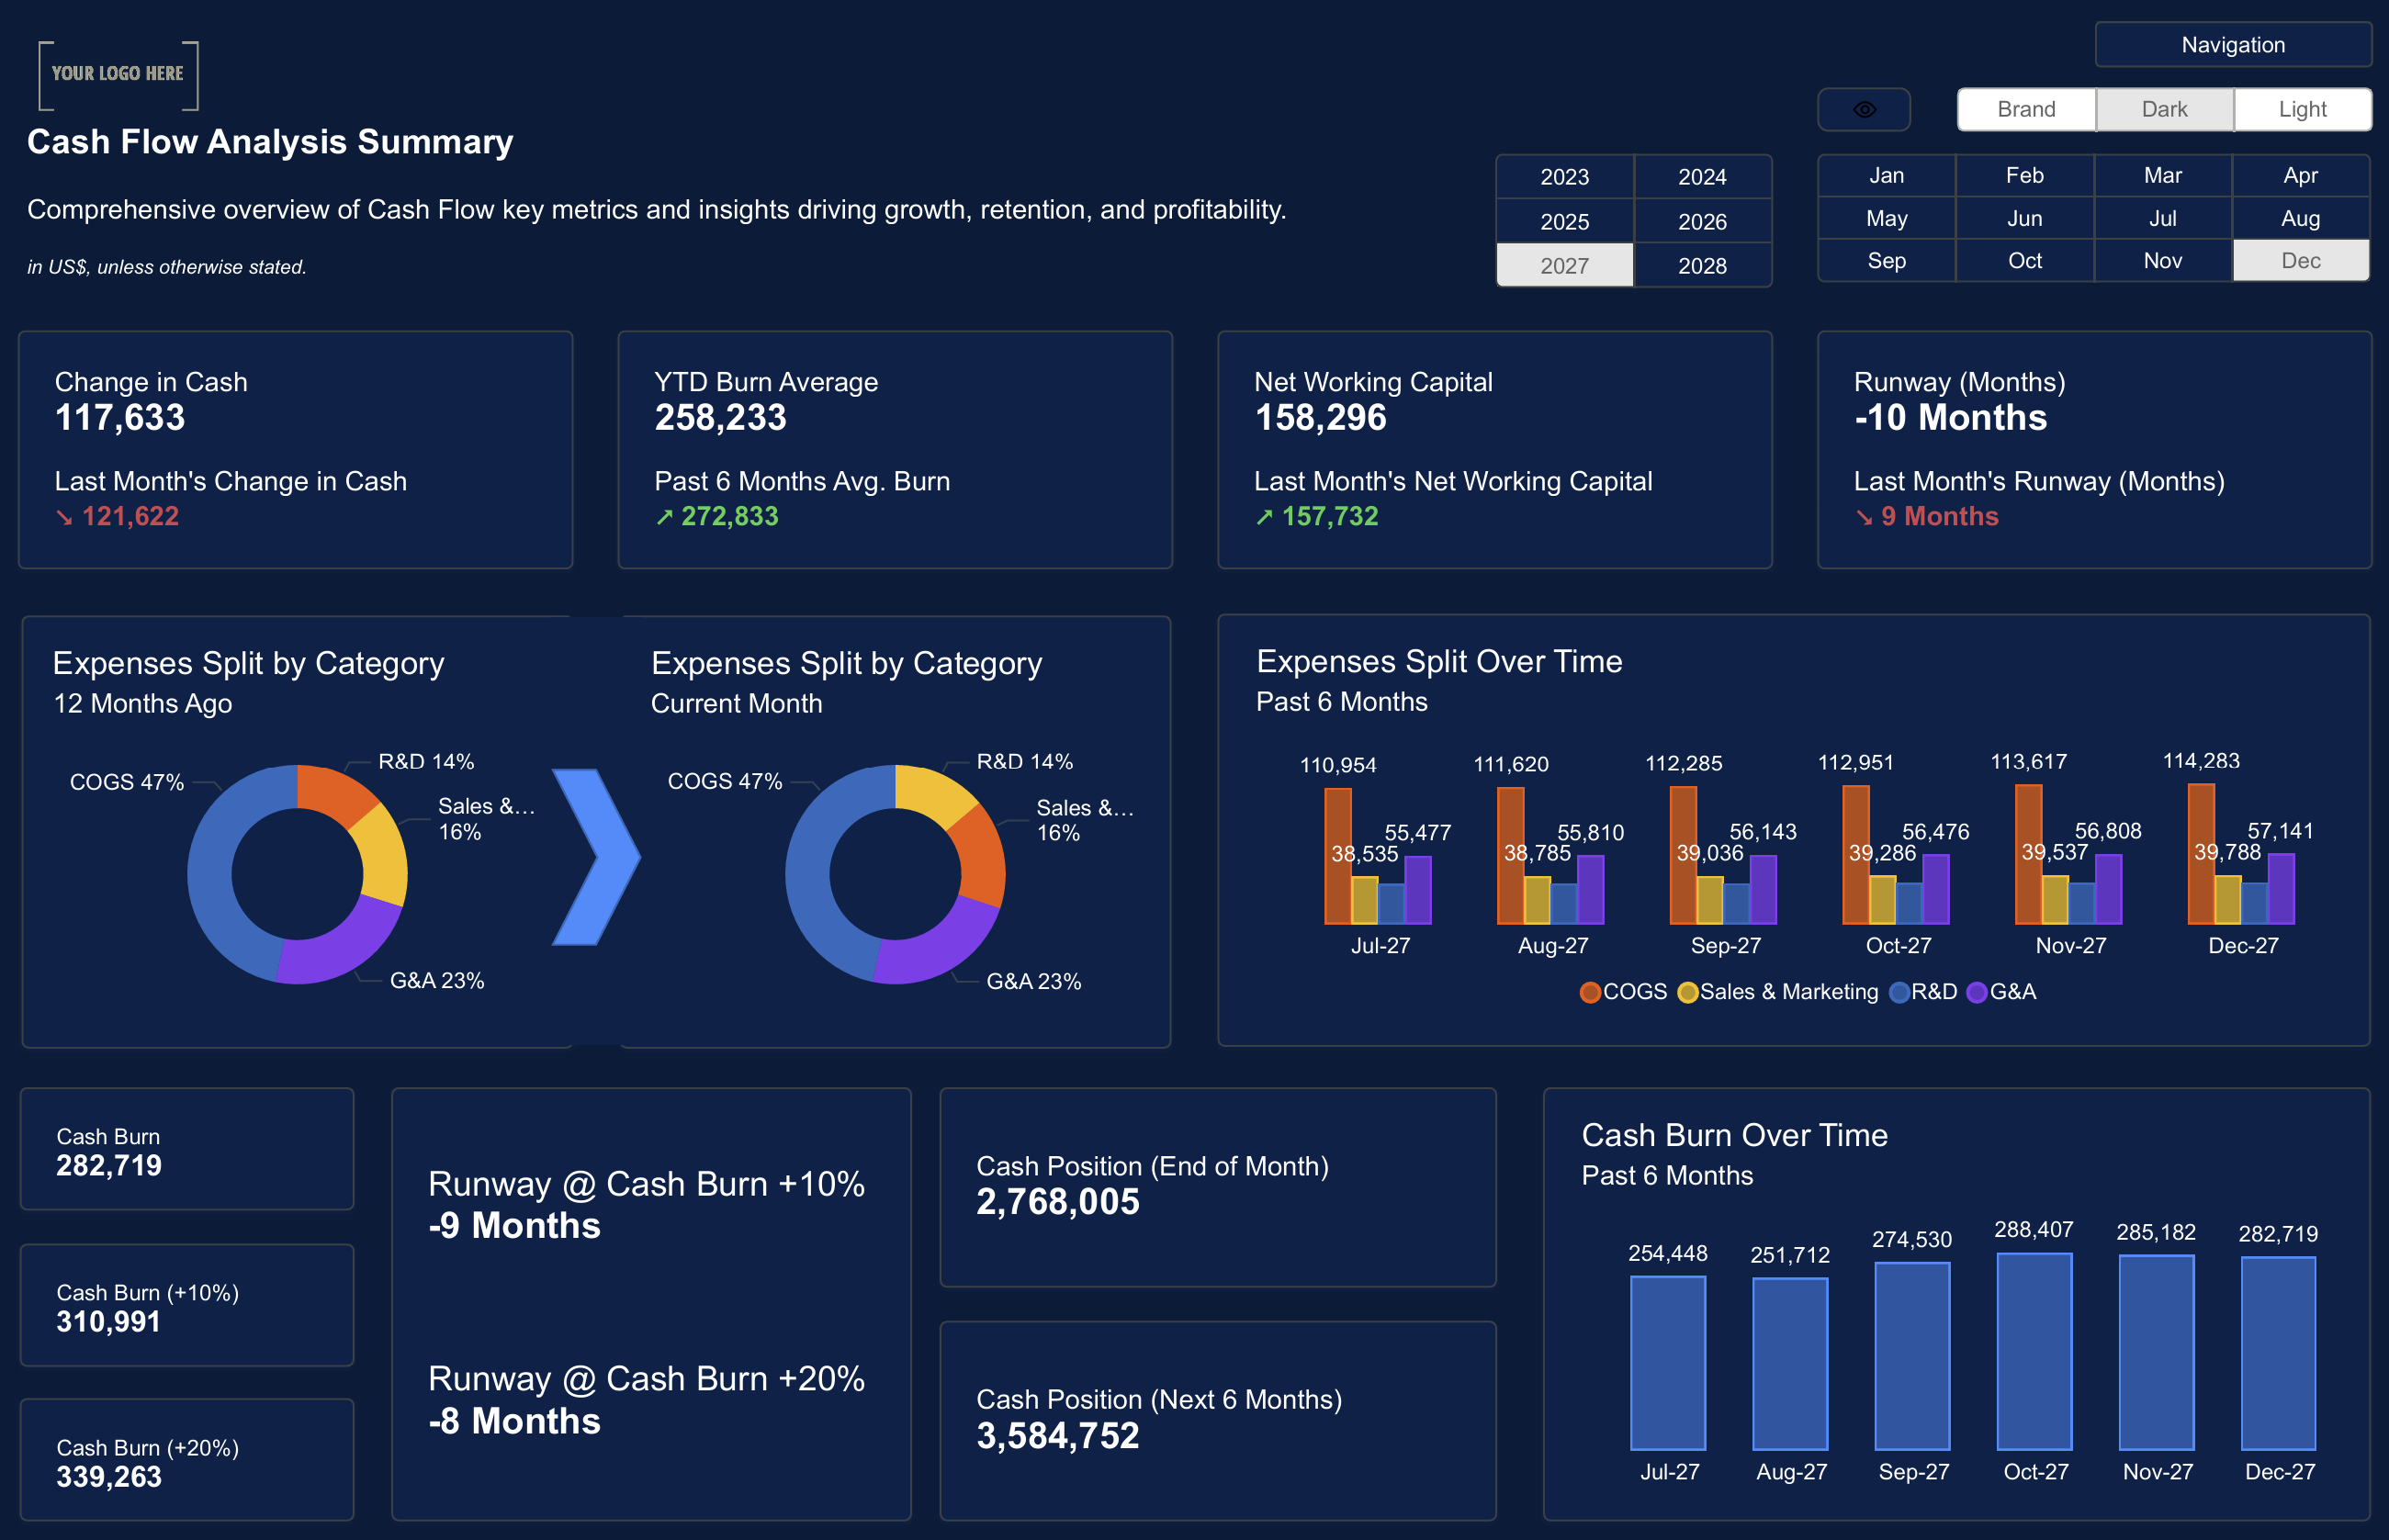
Finance Dashboard Ideas
A Finance Dashboard in Power BI can help you track cash flow, manage expenses, and monitor profit margins. It’s an essential tool for financial planning and budget management.
Key Metrics to Track:
- Cash inflows and outflows
- Monthly profit margins
- Expense breakdowns
- Financial forecasts
Tip: Use a Dark Mode Finance Dashboard to make it easier on the eyes during long work sessions.
 Power BI Data Modeling: Best Practices
Sales Dashboard Ideas
A Sales Dashboard helps you track revenue, monitor the sales pipeline, and measure conversion rates. It’s ideal for sales managers looking to optimize performance.
Key Metrics to Track:
- Total revenue
- Sales pipeline status
- Customer acquisition costs
- Conversion rates
Tip: Use slicers to filter sales data by region, product, or time period.

Marketing Dashboard Ideas
A Marketing Dashboard can help you track campaign performance, measure ROI, and analyze audience engagement.
Key Metrics to Track:
- Campaign ROI
- Click-through rates (CTR)
- Lead conversion rates
- Cost per lead
Tip: Use a Dark Mode Marketing Dashboard to reduce screen fatigue for analysts working long hours

HR Dashboard Ideas
An HR Dashboard is essential for tracking employee performance, attendance, and turnover rates. It’s a great tool for HR managers to improve workforce management.
Key Metrics to Track:
- Employee attendance rates
- Performance evaluations
- Employee satisfaction scores
- Turnover rates
Tip: Use Power BI’s Q&A feature to quickly answer HR-related questions, such as “What is the current headcount?” or “What is the average tenure?”.

Operations Dashboard Ideas
An Operations Dashboard is ideal for monitoring workflows, tracking task completion rates, and identifying bottlenecks in your processes.
Key Metrics to Track:
- Task completion rates
- Workflow timelines
- Productivity by department
- Operational KPIs
Tip: Use automated alerts in Power BI to notify you of missed deadlines or performance drops.
 Power BI Dashboards for Business Growth
Whether you’re managing finance, sales, marketing, HR, or operations, there’s a Power BI dashboard to help you visualize data and make better decisions. By using pre-built templates, you can save time and ensure your dashboards follow best practices.
Ready to build your own dashboards? Download our Power BI templates and get started today!
Download our Power BI Templates now and start building impactful dashboards for your business.Get Started >
Subscribe to our newsletter
Stay ahead with the latest insights, tips, and trends in PowerBI and data visualization.
Join the network that is unlocking the full potential of their data - one dashboard at a time.
Related posts
Explore more insights and tips with these related posts curated just for you.

Mastering the PowerBI Dashboard: Essential Tips for Effective Design

Why Power BI Reporting Dashboards Are Key to Scaling Small Businesses?
