
Most finance teams don't have a voice in strategic planning. Only 40% participate in these decisions, which creates a significant gap in how businesses make choices. Complex financial data makes it hard to communicate clearly, but a financial Power BI dashboard can turn this challenge into a chance to create clear, applicable information.
Power BI combines data from different systems and creates a single source of truth that updates immediately. Users can track cash flow, profitability, and budget variances in one place through interactive visualizations and drill-down features. The process becomes easier with Power BI templates that offer ready-made solutions adaptable to any business's unique needs.
This piece will show you how to build effective financial dashboards in Power BI. You'll learn about template selection and advanced analysis methods that work best for your organization.
Understanding Financial Data Requirements
A meaningful Power BI dashboard needs financial data as its base. Raw financial data rarely comes in perfect format from core databases. You need to know what data you want and how to prepare it before creating visualizations.
Common financial data sources and integration challenges
Building Power BI dashboards that work requires data from multiple sources. Power BI works with many data repositories:
- Files: Excel workbooks, CSV files, PDFs with tabular data
- Databases: SQL Server, Azure SQL, Oracle, and SAP HANA
- Cloud services: Microsoft Fabric, Dataflows, and third-party sources like QuickBooks
Data integration presents the biggest challenge. Financial information comes from several disconnected systems that make consolidation hard. Organizations don't deal very well with different data formats from various sources, which affects report accuracy. The complex relationships between datasets can also cause misinterpretation if not defined correctly.
Key financial metrics worth tracking
Your financial Power BI dashboard should focus on metrics that give useful insights:
- Balance sheet components: Assets, liabilities, liquid assets, and inventory
- Profitability indicators: Revenue, expenses, and net profit margins
- Cash flow metrics: Cash position, accounts receivable, and accounts payable
- Comparative analysis: Budget vs. actual performance, year-over-year growth
These financial KPIs help stakeholders see the organization's financial health and support better decisions.
Data quality considerations for financial reporting
Your financial analysis's reliability depends on data quality. Poor data validation can compromise your Power BI insights. Here are some practices to follow:
- Establish data governance policies to keep data sources, naming conventions, and formats consistent
- Implement validation rules to verify data range, format, completeness, and uniqueness
- Use Power Query transformations to clean and reshape data before it enters your Power BI model
- Document data lineage to track information flow and find discrepancy sources quickly
Clear documentation standards for data sources, transformations, and calculations ensure transparency. A solid foundation built on these data quality practices helps create reliable financial Power BI dashboards that provide applicable information.
 Why You Need a Design System for Power BI Dashboards
Building Your First Financial Dashboard with Power BI Templates
Power BI templates make it easy to build functional financial dashboards. These pre-built frameworks save time and deliver professional results for your financial reports.
Selecting the right Power BI layout template
Power BI Desktop templates give you everything you need to start creating dashboards: report pages, visual elements, data model definitions, and query parameters. Unlike regular Power BI reports (.PBIX files), templates use the .PBIT extension. They're much smaller because they don't have actual data.
Financial analysts will find specialized options like the Modern Finance Dashboard Template. This template has a landing page and sections designed for financial metrics. Many templates come with light and dark themes that match your company's visual priorities.
Customizing pre-built financial templates
Your template needs a personal touch. Start by matching your brand identity through the View > Themes menu. You can adjust color palettes to fit company guidelines. Add financial KPIs that matter to your business—metrics like profit margins, cash flow, and budget variance tracking.
These customization tips will help you create better dashboards:
- Use the same visual types for related metrics
- Remove extra elements to keep layouts clean
- Check how your dashboard handles large datasets
Connecting your financial data sources
The last step links your template to real financial data sources. Power BI works with many data types including Excel files, SQL databases, SharePoint lists, and cloud-based services. Here's how to set up these connections:
- Click "Get Data" on the Home tab
- Pick your data source type
- Enter your login details
- Clean and transform your data in Power Query Editor
After you connect your data, Power BI asks you to link tables together. This enables analysis across different financial metrics. Your dashboard will then update automatically at set times to keep your financial insights fresh.
These pre-built templates, custom adjustments, and reliable data connections help you quickly build a resilient financial Power BI dashboard that gives you useful insights.
Essential Financial Dashboard Types and Their Components
Power BI financial dashboards turn complex data into valuable business intelligence. Finance professionals should implement these four essential dashboard types to improve their decision-making.
Cash flow and liquidity dashboards
Strong cash flow dashboards give financial managers up-to-the-minute monitoring of ending cash balances and vital insights into available liquidity. The dashboards show inflows and outflows that help spot patterns leading to potential cash shortages. CFOs, controllers, and treasurers depend on liquidity visualizations to track trends in current ratio, debt-to-asset ratio, and cash positions. A good liquidity dashboard has the equity-to-debt ratio that balances your business's equity and debt to lower financial risk.
Profitability and revenue analysis
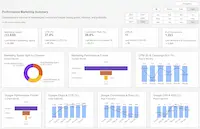
CFOs track crucial metrics through profitability dashboards that shape executive decisions. The gross margin percentage (42.5% in one sample case) shows immediate profitability insights. Team scorecards help managers watch performance across business units. The dashboards match company metrics against industry standards to explain trends and overall profitability.
Budget vs. actual performance tracking
Budget comparison dashboards show how well organizations perform by matching actual figures with budgeted amounts. Managers can spot areas of overspending or underspending quickly and adjust budgets when needed. Variance indicators track specific categories against allocated budgets. Gage widgets display actual income and expenses as percentages of budget targets, which creates easy-to-understand visual references.
Financial forecasting visualizations
Power BI's statistical capabilities help forecasting dashboards predict future trends from historical data. The visualizations use exponential smoothing or ARIMA models that work well with time series data. Users can customize forecast parameters like length, confidence intervals, and seasonality adjustments. Advanced users can add Python or R scripts to include variables like seasonality, holidays, and external market conditions for better predictions.

Advanced Financial Analysis Techniques in Power BI
A financial Power BI dashboard shows its true analytical strength through advanced techniques that turn raw numbers into strategic insights. Here are four powerful approaches that lift financial analysis to new heights.
Creating calculated financial metrics with DAX
DAX is the formula language that drives sophisticated calculations in Power BI. These DAX measures respond to user interactions in real-time and let you explore financial data quickly. You'll see these calculated measures with calculator icons in your Fields list, ready to use in visualizations like any other field. DAX offers more than 200 functions to build flexible financial models. Your finance team can create measures like Projected Sales = SUM('Reseller Sales'[Last Years Sales])*1.06 to calculate future revenue projections without complex spreadsheets.
Time intelligence for period-over-period comparisons
Time intelligence functions make precise financial comparisons between different periods simple. These specialized DAX functions help you analyze trends by matching current performance against historical data. Functions like SAMEPERIODLASTYEAR calculate metrics for similar periods in previous years, which you need for year-over-year analysis. Your finance teams can then create measures that show period-over-period growth percentages automatically. This becomes invaluable when you explore fiscal performance across months, quarters, or years without recreating calculations manually.

Scenario modeling and what-if analysis
What-if analysis turns your financial dashboards from historical reports into strategic planning tools. The Modeling tab lets you create parameters to simulate different business scenarios. Start by defining parameters for key variables like price adjustments or discount percentages. Next, build DAX measures that use these parameters, such as New_Forecast = SUMX(Sheet1, IF(Sheet1[Slope] + ((1 + 'Price Parameter'[Price Parameter Value]) * Sheet1[Price] * Sheet1[Price Coefficient]) > 0, Sheet1[Slope] + ((1 + 'Price Parameter'[Price Parameter Value]) * Sheet1[Price] * Sheet1[Price Coefficient]), 0)). This shows you instantly how changing conditions affect financial outcomes.
Drill-through capabilities for financial investigation
Drill-through features let financial analysts dive deep into specific data points. Your users can right-click on financial metrics to see contextual details filtered to that specific entity through drill-through pages. The finance team can build dedicated drill-through pages for suppliers, customers, or products that display relevant financial metrics. On top of that, cross-report drill-through connects related financial reports in the same workspace and passes filter context between them. This creates uninterrupted investigation across your financial reporting ecosystem.
 Top Power BI Dashboards for HR Reporting and Employee Analytics
Conclusion
Power BI dashboards excel at converting raw financial data into valuable analytical insights. Teams can make better business decisions by combining smooth data integration, smart template choices, and sophisticated analysis methods.
The success of Power BI dashboards relies on three key elements. Clean and integrated data sources form the foundation. Selecting the right dashboard type matches specific analysis requirements. Expertise in advanced features like DAX calculations and drill-through options completes the picture. These components enable finance teams to move beyond simple reporting and deliver strategic analysis.
Power BI serves as more than just a visualization tool. It acts as a vital asset that connects complex financial data with clear business insights. The initial learning process might feel challenging. However, teams quickly see the benefits as they make faster decisions based on live financial information.
FAQs
Q1. What are the key benefits of using Power BI for financial dashboards? Power BI transforms complex financial data into clear, actionable insights. It centralizes data from multiple sources, offers real-time updates, and provides interactive visualizations. This enables finance teams to track essential metrics like cash flow, profitability, and budget variances in one place, supporting better decision-making.
Q2. How can I ensure data quality in my financial Power BI dashboard? To maintain data quality, establish data governance policies, implement validation rules, use Power Query for data cleaning, and document data lineage. These practices help ensure consistency, accuracy, and transparency in your financial reporting, which is crucial for reliable insights.
Q3. What are some essential types of financial dashboards I should consider creating? Key financial dashboard types include cash flow and liquidity dashboards, profitability and revenue analysis dashboards, budget vs. actual performance tracking dashboards, and financial forecasting visualizations. Each type focuses on different aspects of financial health and performance.
Q4. How can I leverage Power BI templates for creating financial dashboards? Power BI templates provide pre-built frameworks that save time in dashboard creation. Start by selecting a suitable template, customize it to match your brand and specific financial KPIs, and then connect it to your financial data sources. This approach allows you to quickly establish a robust financial dashboard.
Q5. What advanced techniques can I use to enhance my financial analysis in Power BI? Advanced techniques include creating calculated financial metrics with DAX, using time intelligence for period-over-period comparisons, implementing scenario modeling and what-if analysis, and utilizing drill-through capabilities. These methods allow for more sophisticated financial analysis and deeper insights into your data.
Boost your reporting speed and consistency—download our Financial Power BI Dashboard template and streamline your analytics today!Get Started >
Subscribe to our newsletter
Stay ahead with the latest insights, tips, and trends in PowerBI and data visualization.
Join the network that is unlocking the full potential of their data - one dashboard at a time.
Related posts
Explore more insights and tips with these related posts curated just for you.

Top 10 Power BI Dashboard Examples to Boost Business Insights
Mastering the Power BI Dashboard: Essential Tips for Effective Design
