Every Power BI user starts in the same place: a blank canvas. It’s a field of infinite possibilities, which is exactly the problem. Most teams treat this blank screen as an invitation to build a unique masterpiece, a bespoke dashboard tailored to their every whim.
This is a profound, and expensive, mistake.
The truth is, your business problems aren't that unique. The challenges of managing cash flow, tracking sales, and monitoring operations are universal. Reinventing the wheel every time you need to visualize data is a vanity project your business can't afford. The key isn't building from scratch; it's about having a system that delivers clarity on demand.
The fastest path to that clarity is through battle-tested frameworks. You need to stop building and start deciding. This isn't about limiting your analysis; it's about launching it from a place of strength.
Reveal the Real Problem
Here’s what smart, well-funded teams still get wrong: they fall in love with the process, not the outcome. They spend weeks, even months, building intricate dashboards that track every vanity metric under the sun. They commission data art projects that look impressive on a big screen but fail the only test that matters: does this report help me make a better, faster decision?
Most of the time, the answer is no.
This obsession with custom builds is a hangover from a time when data was scarce and tools were clunky. Today, the bottleneck isn't data; it's attention. Your old tools are actively working against you. That labyrinth of Excel sheets is a static prison. The formulas break, the versions conflict, and you’re always looking in the rearview mirror. A senior analyst once told me they spent 60 hours - a week and a half of their life—building a marketing attribution dashboard. It was obsolete a month later when the strategy shifted.
The symptoms are painfully familiar:
- Wasted Hours: Your highest-paid analysts and operators are stuck being data janitors, cleaning and wrangling data instead of interpreting it.
- Circular Meetings: Discussions about "what the numbers mean" devolve into arguments about "where the numbers came from."
- Strategic Blind Spots: You’re so focused on tracking last month’s ad clicks you completely miss the fact that your cash runway just shrank by 30 days.
This isn’t a tooling problem. It's a systems problem. You’re asking a blank canvas to provide you with a strategic roadmap. It will never work.
 Power BI Templates
Reframe the Thinking
The solution isn't a better dashboard. It's a better starting point. You need to shift your entire approach from "What data can we possibly show?" to "What questions must we consistently answer?"
I call this the 80/20 of Business Intelligence.
The principle is simple: 80% of your most critical, company-saving decisions will come from just 20% of your metrics. The trick is knowing which 20% to obsess over. And here’s the secret: for 99% of businesses, that critical 20% is identical.
- Are we profitable?
- Are we running out of cash?
- Is our sales pipeline growing?
- Are our customers sticking around?
- Is our marketing spend working?
You don’t get extra points for discovering these questions. You only get punished for failing to answer them. This is where Power BI Templates change the game. A template is not a restrictive box; it's a launchpad. It’s the 80/20 principle, codified into a ready-to-use tool. It embeds years of best practices, costly mistakes, and hard-won lessons into a dashboard you can deploy in minutes, not months.
It forces you to focus on the vital few metrics instead of getting lost in the trivial many. This isn't about dumbing down your data. It's about elevating your focus to a strategic level, instantly.
 10 Real-World Power BI Dashboard Examples (With Screenshots)
What Good Looks Like
When you stop building from zero, you start winning. Adopting a template-first approach gives you an immediate, standardized view of your business's health. You're not just buying a dashboard; you're buying clarity and speed. According to Gartner, organizations are operationalizing AI and analytics at a blistering pace, creating a massive need for efficient data infrastructures. Templates are that efficiency.
Here are the seven foundational Power BI dashboard examples every small business should have on hand:
- The Financial Health Dashboard: This is your command center. It visualizes your P&L, balance sheet, and cash flow. Most importantly, it tracks cash runway and burn rate. It’s the “Are we alive next quarter?” report that every founder needs to see daily.
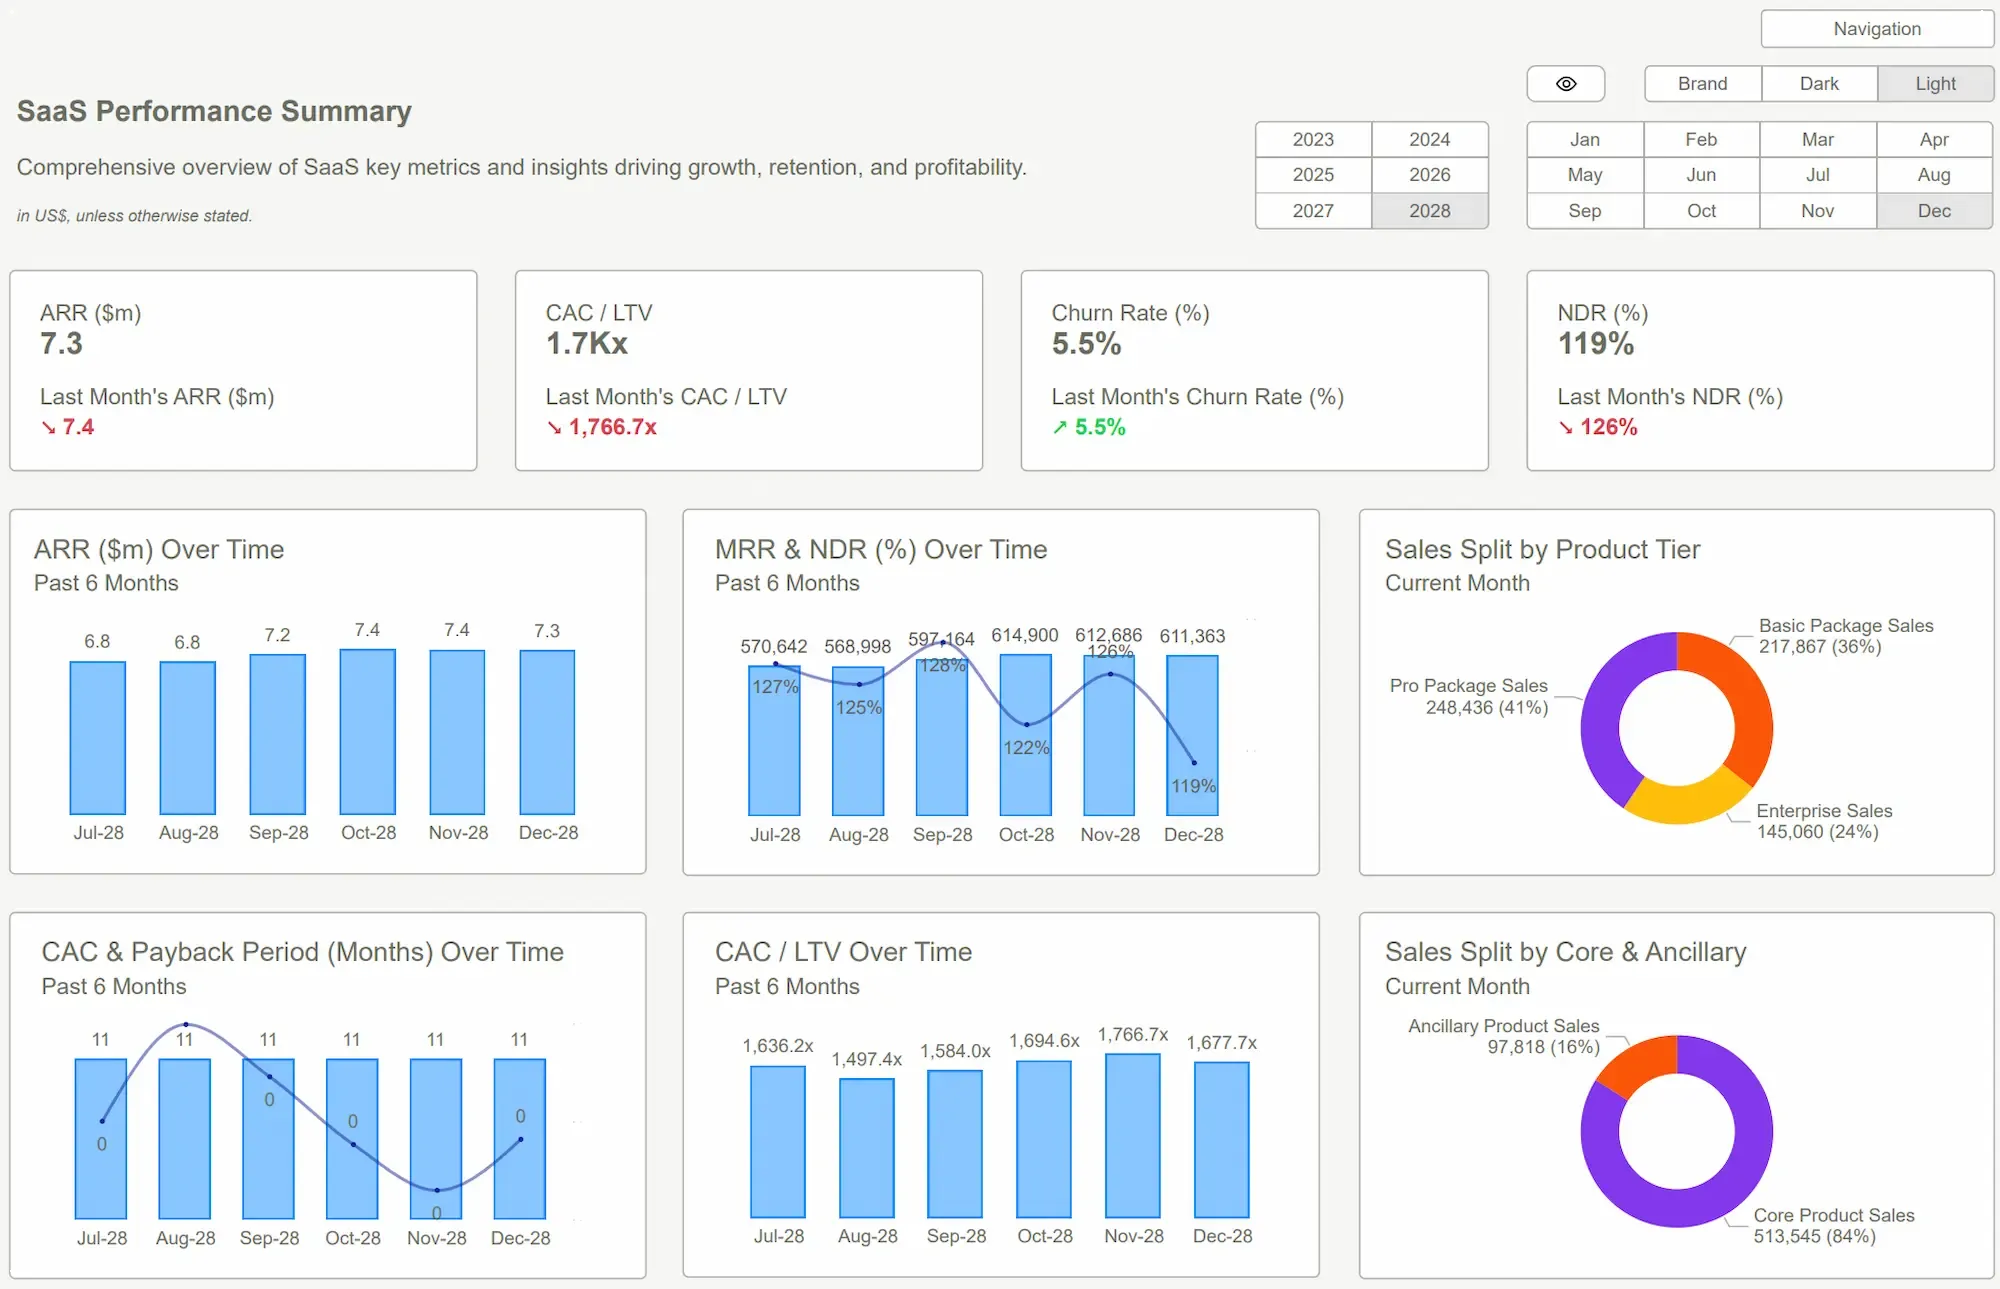
- The SaaS & MRR Dashboard: For any subscription business, this is non-negotiable. It tracks MRR/ARR, net revenue retention, churn rates (both logo and revenue), and customer lifetime value (LTV). It separates the signal of sustainable growth from the noise.
- The Sales Pipeline & Forecast Template: Your sales team lives in the CRM. You live in reality. This template bridges the gap, visualizing pipeline stages, conversion rates, deal velocity, and sales cycle length. It turns subjective sales forecasts into objective data.
- The Marketing Funnel & ROI Template: Stop burning cash. This dashboard connects marketing spend to results, tracking Cost Per Lead (CPL), Customer Acquisition Cost (CAC), and channel performance. It helps you double down on what works and kill what doesn’t, fast.
- The HR & Headcount Dashboard: Your biggest expense is your people. This template tracks headcount, salary costs, department budgets, and employee turnover. It’s essential for scaling without breaking the bank.
- The Operational Efficiency Dashboard: Whether you run a service business or a product team, this template tracks project progress, resource allocation, and key operational KPIs. It helps you spot bottlenecks before they derail your roadmap.
- The Executive Summary Dashboard: This is your one-page board report. It rolls up the single most important KPI from each of the other six dashboards into one high-level view. It’s designed for high-stakes meetings where clarity is everything.
Adopting these isn't an expense; it's an investment with immediate ROI. The cost of one template is less than a few hours of an analyst's time. The value it provides is incalculable.
 Data Visualization Best PracticesPower BI Dashboard
Conclusion
Let's be blunt. Your goal is not to become an expert dashboard developer. Your goal is to run a successful business. The obsession with building custom analytics from scratch is a dangerous distraction that costs you your most valuable resources: time and focus.
The mindset shift is simple but powerful: move from being a builder to being a decision-maker. Stop admiring the problem on a blank canvas and start with the answer. This is what professionally designed Power BI Templates provide—a shortcut to the insights that matter. They distill complex business logic into a clear, actionable picture.
You wouldn't build your own accounting software or your own CRM. So why are you building your own business intelligence system from the ground up? Your competition is moving faster than ever. You can’t afford to be stuck in the starting blocks.
Your data holds the answers. Our templates unlock them. Stop wasting time in spreadsheets and start making better decisions by tomorrow. Explore the Power BI Kit and find the template that gives you back your time.Get Started >
Subscribe to our newsletter
Stay ahead with the latest insights, tips, and trends in PowerBI and data visualization.
Join the network that is unlocking the full potential of their data - one dashboard at a time.
Related posts
Explore more insights and tips with these related posts curated just for you.

What Makes a Good Power BI Dashboard? Design Principles and Examples

Power BI Dashboard Examples That Save Time, Impress Leadership, and Actually Work