You're drowning in data but starving for insights. Every platform—from your accounting software to your CRM—spits out its own numbers, leaving you to stitch together a story from a dozen messy spreadsheets. This is the default state for most small businesses, and it’s a costly one.
The common misconception is that the solution requires a massive, ground-up effort. You believe you either need to hire an expensive consultant or become a part-time data analyst yourself, wrestling with DAX formulas and visual settings in Power BI for weeks on end.
This is a trap. The goal isn't to build a dashboard; it's to use one to make smarter, faster decisions. The truth is that the right Power BI templates are a strategic shortcut. They streamline insights, eliminate guesswork, and free you from the soul-crushing task of reinventing the wheel. You don't need another project; you need answers. And you need them now.
Your DIY Dashboard is a Ticking Time Bomb
Let’s be brutally honest: most founders get data visualization completely wrong. They fixate on the tool, not the outcome. They spend a month trying to build the “perfect” dashboard, only to create something that’s either too complex to use or too simple to be useful.
This is why so many well-intentioned data projects fail. The path is littered with predictable pitfalls:
- The DIY Delusion: You’re a founder, a marketer, or an operator. Your highest value is in strategy and execution, not debugging a CALCULATE function at 11 PM. Every hour you spend on dashboard design is an hour you’re not spending on growing the business.
- The Consultant Cash Burn: You hire a BI consultant who charges a fortune, takes six weeks to understand your business, and delivers a generic, over-engineered dashboard that you’re afraid to touch. It quickly becomes a relic.
- The Spreadsheet Crutch: Your custom dashboard breaks or shows conflicting numbers. Trust erodes. Before you know it, everyone reverts to their own version-controlled spreadsheets, and you’re back to arguing about whose data is “right” in meetings.
The result is a “dashboard graveyard”—a collection of beautifully designed but utterly ignored Power BI reports. The real cost isn't the time or money spent; it's the strategic drift, missed opportunities, and poor decisions made while you were flying blind. As Gartner highlights, without a clear focus on user decisions, BI tools often fail to deliver tangible business value.
 Power BI Templates
Reframe Your Thinking: The "Plug-and-Play Insight" Model
The flawed approach to business intelligence is thinking like a builder. The smarter approach is thinking like an investor—your time and capital are finite resources that demand an immediate return.
Forget the “Build-to-Analyze” model. It’s a broken workflow for resource-strapped businesses.
The Flawed Model:
- Start with a blank Power BI canvas.
- Spend weeks connecting data sources and learning DAX.
- Agonize over chart types, colors, and layouts.
- Build a fragile, hard-to-maintain dashboard.
- Get frustrated, lose trust in the data, and abandon it.
Embrace the “Plug-and-Play Insight” model instead. Your job isn't to be a data architect; it’s to be a decision-maker.
The Effective Model:
- Start with a professionally designed, expert-vetted Power BI template.
- Connect your existing data sources in minutes.
- Get immediate, actionable insights from pre-built KPIs and visuals.
- Make data-driven decisions that impact your bottom line.
This isn’t cheating; it’s leverage. At Power BI Kit, we've already done the heavy lifting. We’ve spent thousands of hours on data modeling, KPI selection, and visual design so you can bypass the build trap entirely. Our templates are the strategic assets that turn your raw data into your most powerful competitive advantage.

What Good Looks Like: 7 Essential Power BI Templates
When you stop building and start using, the fog of uncertainty lifts almost instantly. You go from guessing to knowing. Here are seven must-have Power BI dashboard examples that small businesses should implement immediately to find clarity and drive growth.
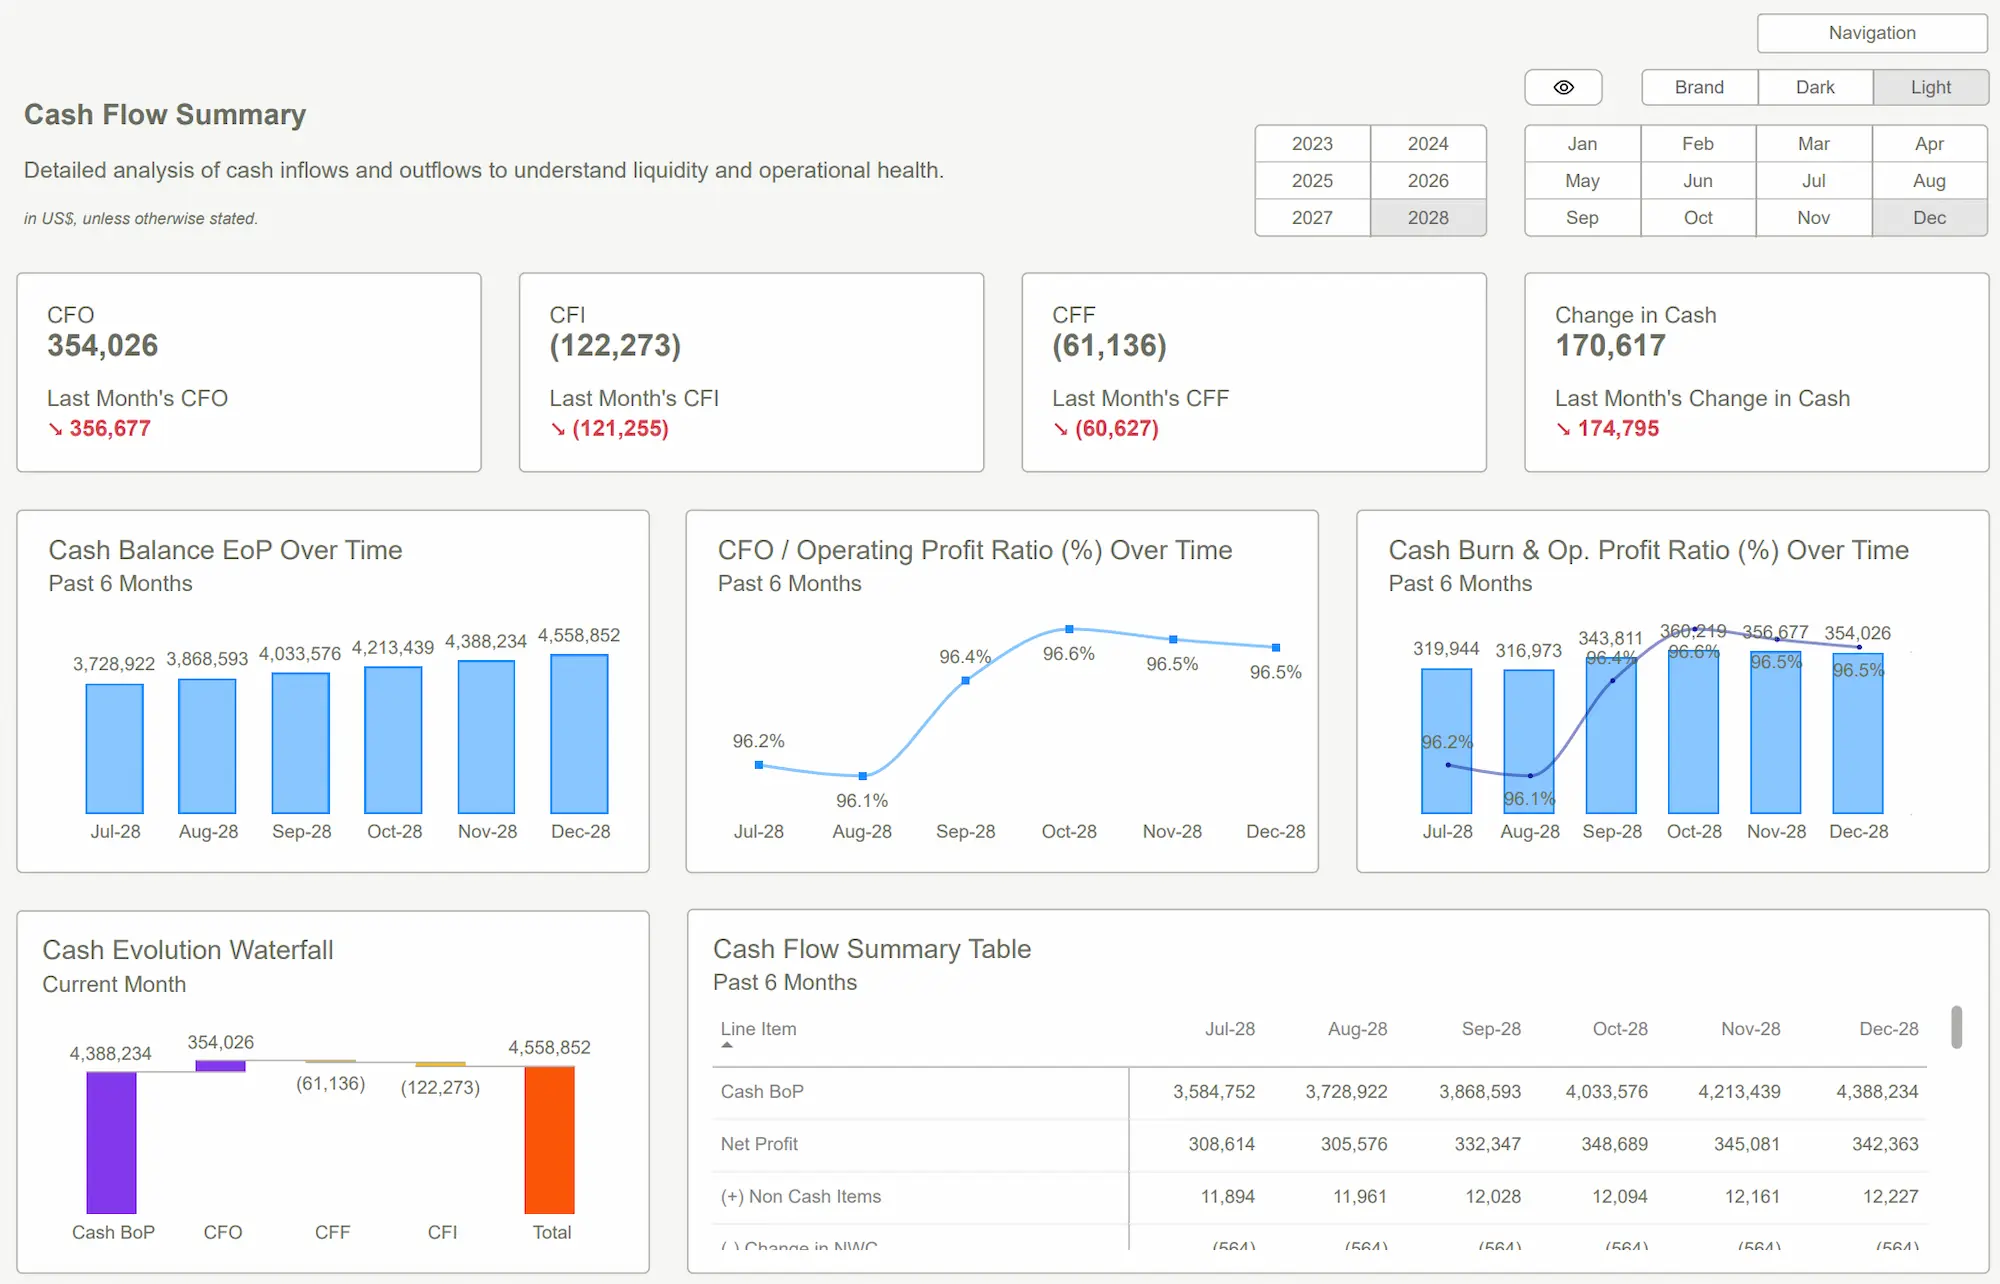
1. The Financial Health Dashboard
- The Blind Spot: You see your bank balance, but do you really know your financial position? Where is cash going? What's your real burn rate? Are you on track to hit profitability?
- The Clarity: This Power BI dashboard instantly visualizes your P&L, cash flow, runway, and burn rate. It compares performance against budget and historical trends, flagging anomalies before they become crises.
- The Strategic Win: Secure a bridge round with confidence, negotiate better payment terms with vendors, and make critical spending decisions based on real-time data, not gut feel.
2. The Sales Pipeline & Performance Dashboard
- The Blind Spot: Your CRM is full of deals, but your revenue forecast feels like a fantasy. Where are deals getting stuck? Who are your top performers? Is your sales cycle getting longer?
- The Clarity: Track your sales funnel from lead to close. Monitor conversion rates at each stage, average deal size, and sales velocity. Compare individual and team performance against targets.
- The Strategic Win: Unclog your pipeline, provide targeted coaching to your sales team, and build a predictable revenue engine.
3. The Marketing ROI Dashboard
- The Blind Spot: You’re spending money on ads and content, but what’s actually working? Which channels are driving profitable customers versus vanity metrics?
- The Clarity: Connect your ad platforms and analytics to see Cost Per Acquisition (CAC), Customer Lifetime Value (LTV), and ROI by channel. Understand which campaigns are winners and which are draining your budget.
- The Strategic Win: Double down on your most profitable marketing channels and cut the losers. Lower your CAC and improve overall marketing efficiency.
4. The SaaS Metrics Dashboard
- The Blind Spot: For subscription businesses, top-line revenue is a vanity metric. Are you secretly bleeding customers? Is your growth healthy or hollow?
- The Clarity: This template focuses on the metrics that matter: Monthly Recurring Revenue (MRR), churn rate (both logo and revenue), LTV, and Average Revenue Per User (ARPU).
- The Strategic Win: Proactively address churn drivers, identify up-sell opportunities, and prove a scalable, sustainable business model to investors.
5. The HR & People Analytics Dashboard
- The Blind Spot: Your team is your biggest asset and usually your biggest expense. Are you tracking the key trends in headcount, turnover, and employee costs?
- The Clarity: Visualize headcount growth by department, monitor voluntary vs. involuntary turnover, and analyze compensation trends.
- The Strategic Win: Improve retention, plan hiring more effectively, and manage payroll costs to ensure you can afford the talent you need to scale.

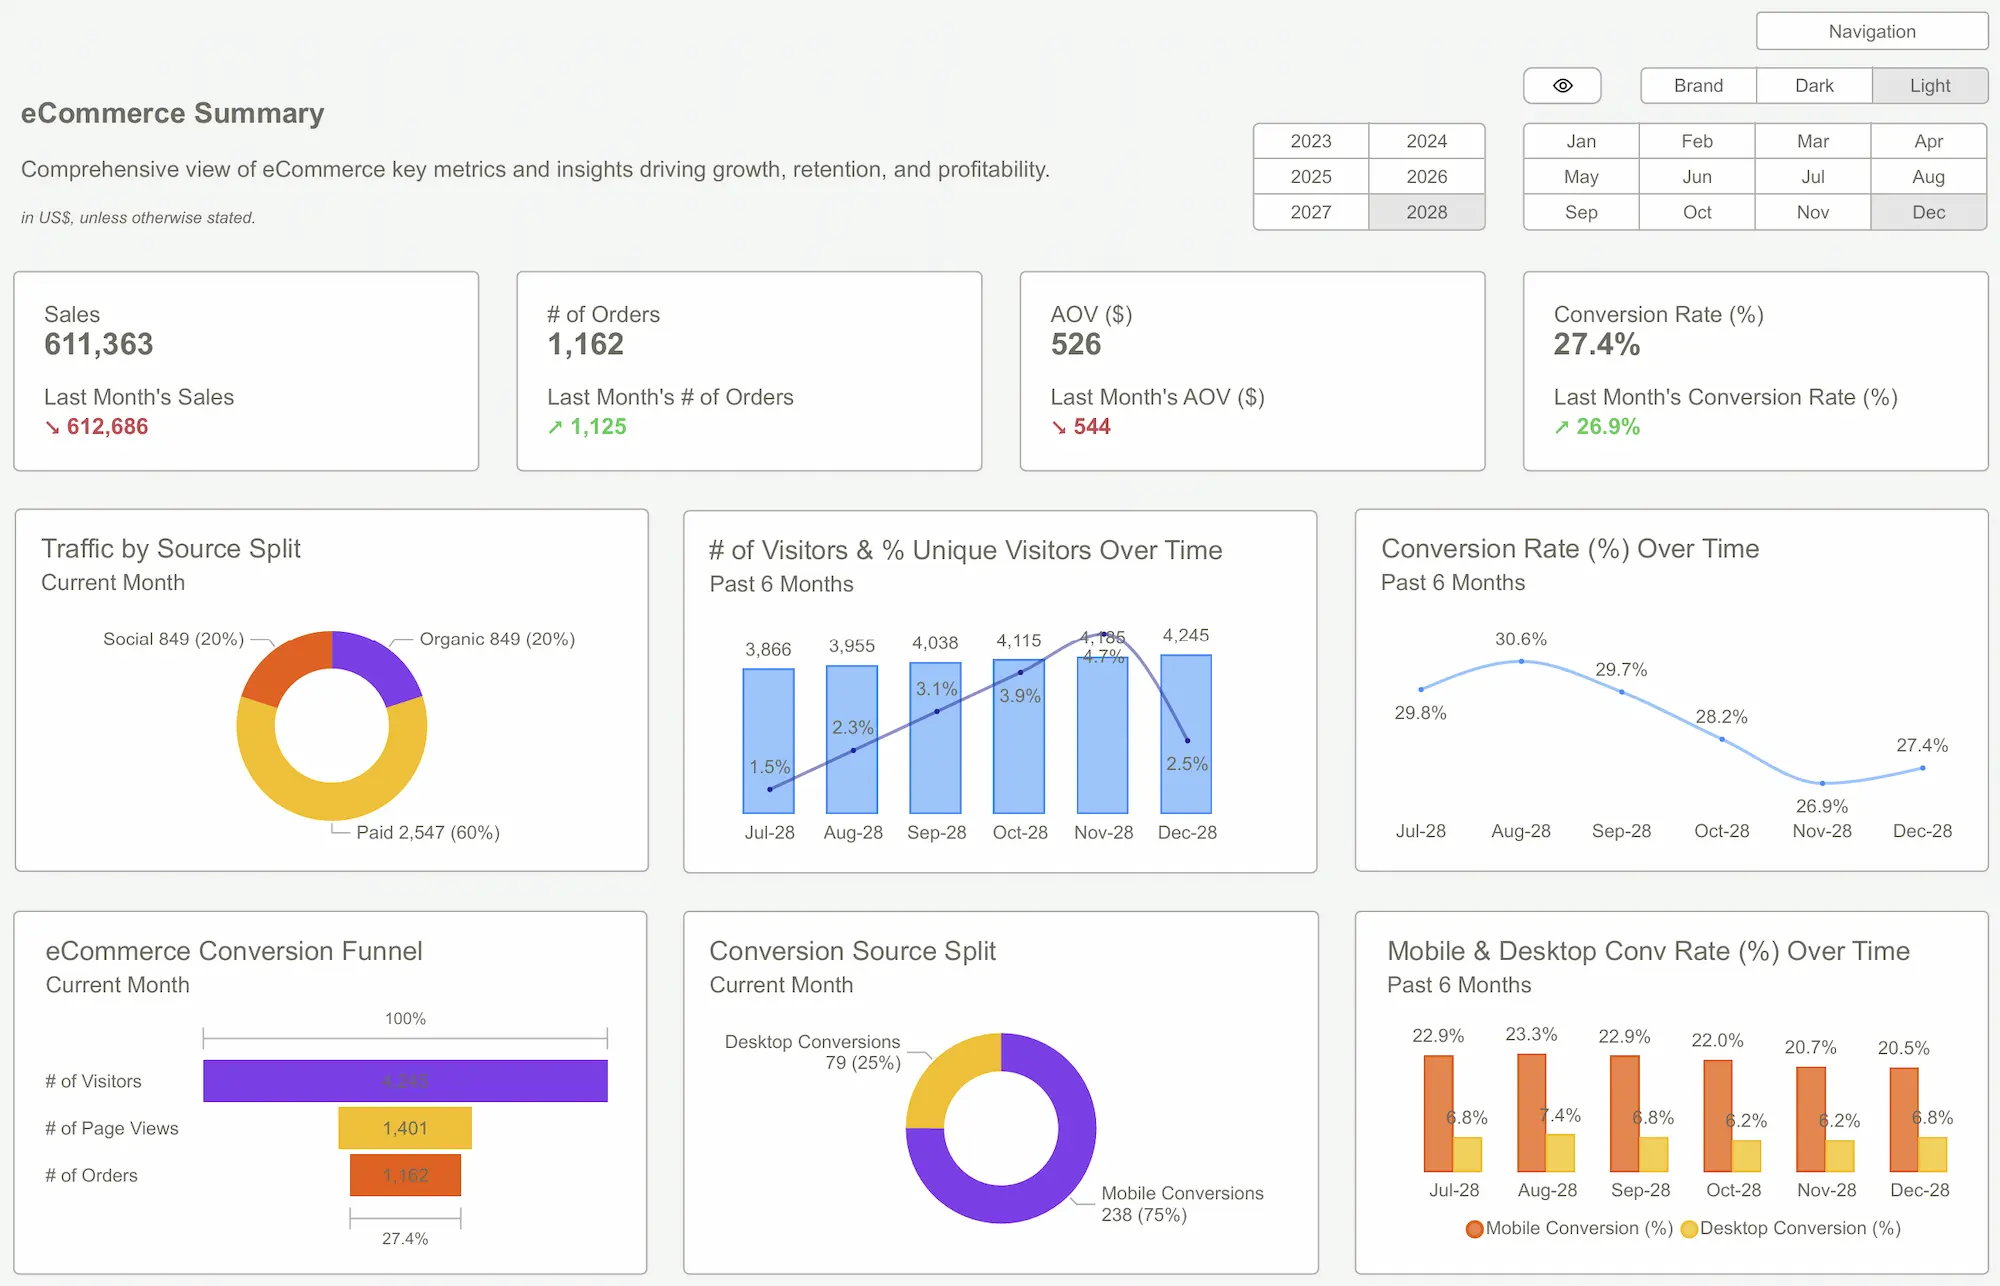
6. The E-commerce Performance Dashboard
- The Blind Spot: You know your daily sales, but the "why" is a mystery. Why did conversions drop yesterday? What are your most profitable products?
- The Clarity: Get a unified view of your store’s performance, including conversion rate, Average Order Value (AOV), top-selling products, and customer purchasing behavior.
- The Strategic Win: Optimize your product pages, run smarter promotions, and improve inventory management based on what customers are actually buying.
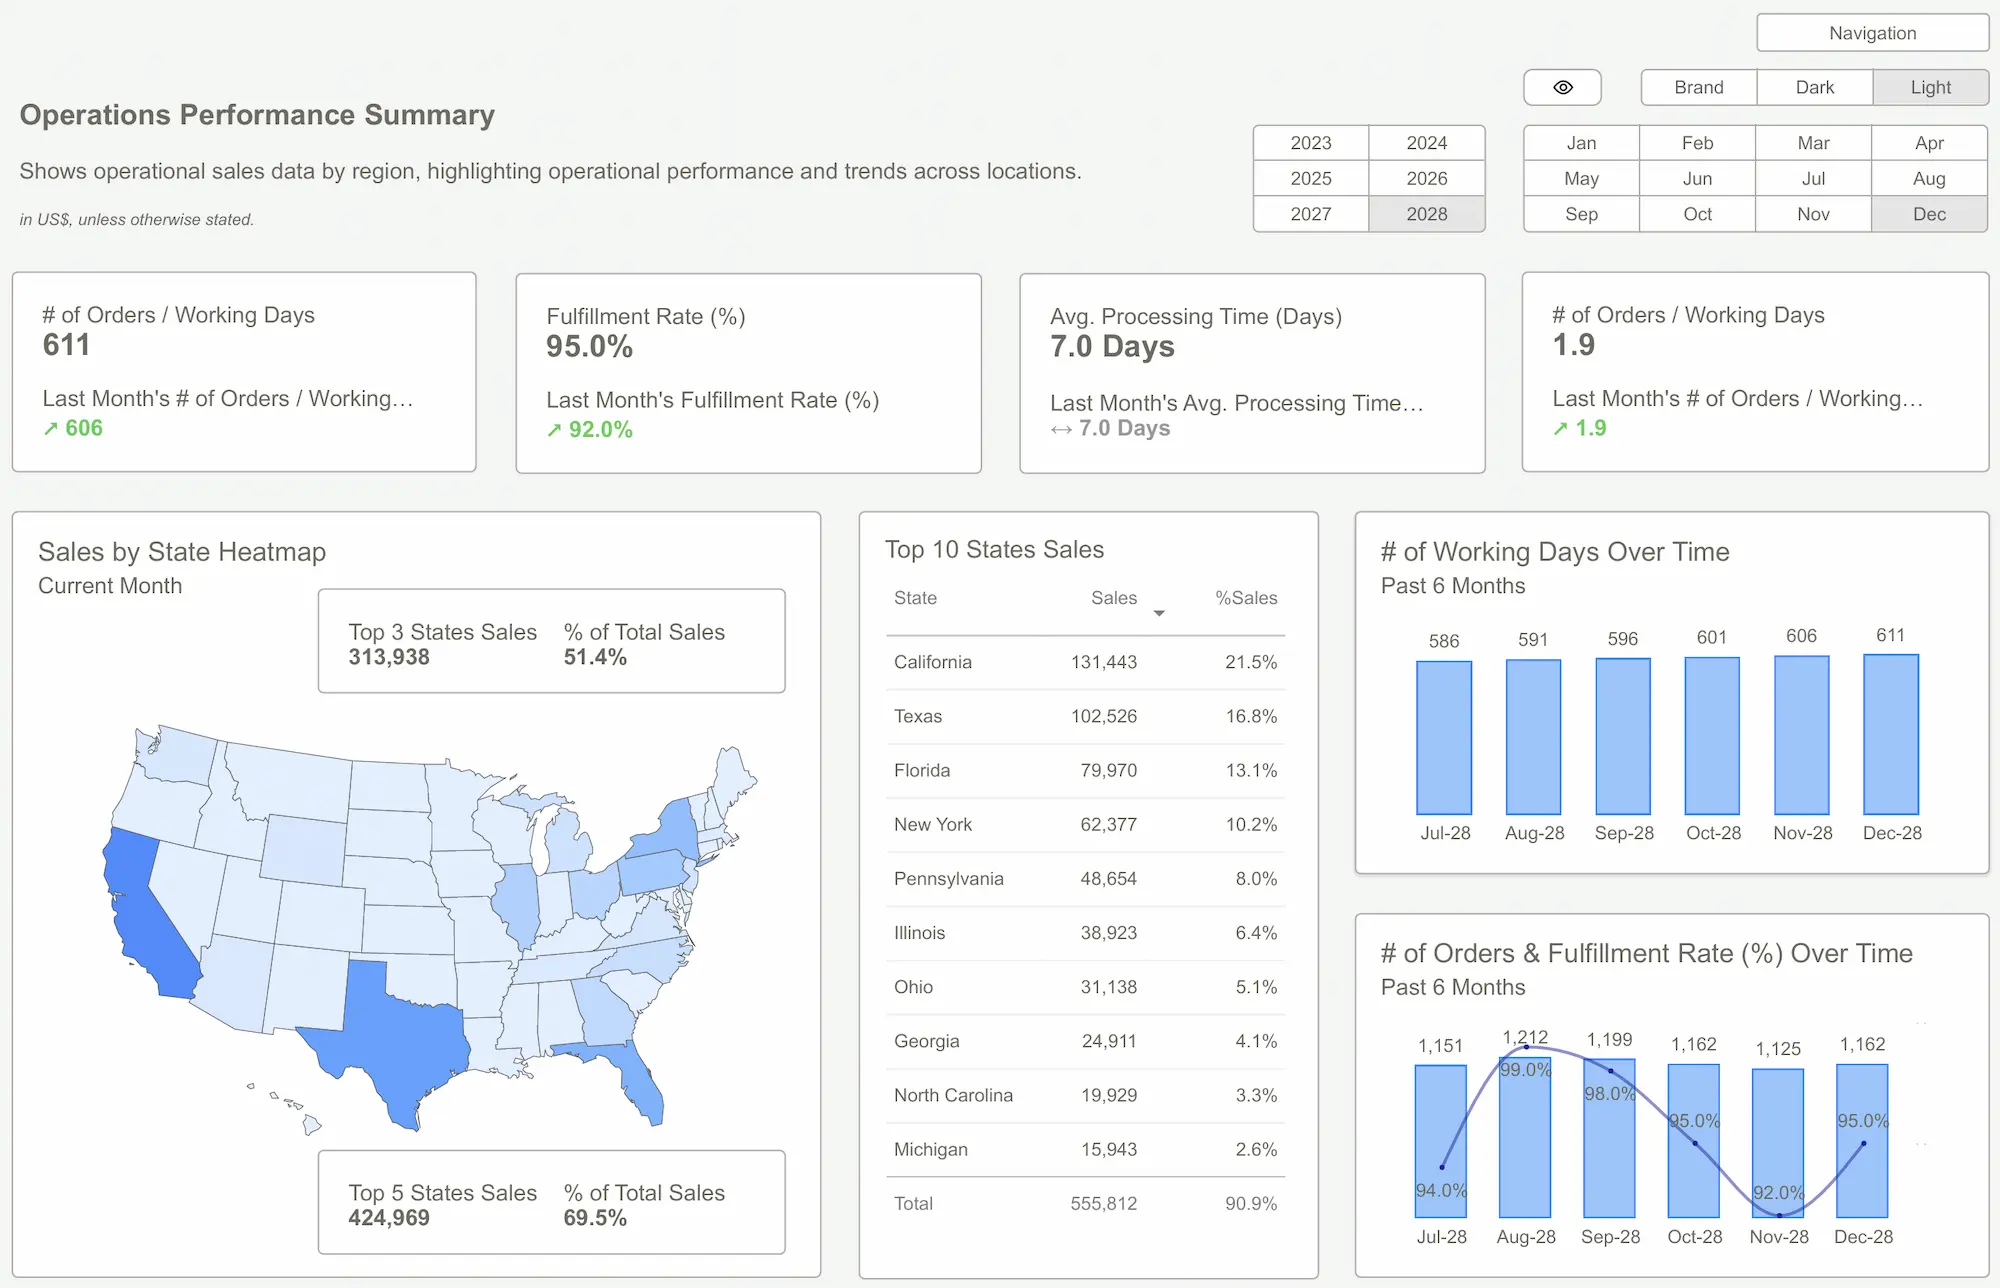
7. The Operational Efficiency Dashboard
- The Blind Spot: It feels like your team is busy, but are they effective? Are projects on schedule? Are support tickets being resolved quickly?
- The Clarity: Track key operational metrics like project completion rates, resource allocation, and customer support resolution times. Identify bottlenecks in your internal processes.
- The Strategic Win: Improve team productivity, enhance customer satisfaction, and build scalable systems that won’t break as you grow.
 5 Real Power BI Dashboard Examples
Conclusion
The fundamental shift isn't about adopting a new tool; it's about adopting a new mindset. Stop thinking of yourself as a data janitor, forced to clean up messy reports. Start thinking like a CEO who demands immediate, reliable answers. Decision fatigue is a real threat to founders, and operating with ambiguous data only makes it worse, as detailed by Harvard Business Review.
The urgency is real. Every day you operate in a data fog is another day of missed opportunities, wasted capital, and strategic gambles. The answers to your most pressing business questions are already sitting in your data, waiting to be unlocked.
The right Power BI templates are the key. They eliminate the noise and give you the signal, allowing you to move with the speed and confidence your business demands. Your data already has the answers. It’s time you started listening.
Tired of guessing? Stop wasting time building from scratch and get the clarity you need in minutes. Explore our full suite of professional Power BI Templates and find the right fit for your business today.Get Started >
Subscribe to our newsletter
Stay ahead with the latest insights, tips, and trends in PowerBI and data visualization.
Join the network that is unlocking the full potential of their data - one dashboard at a time.
Related posts
Explore more insights and tips with these related posts curated just for you.

Top 10 Power BI Dashboard Examples to Boost Business Insights
Mastering the Power BI Dashboard: Essential Tips for Effective Design