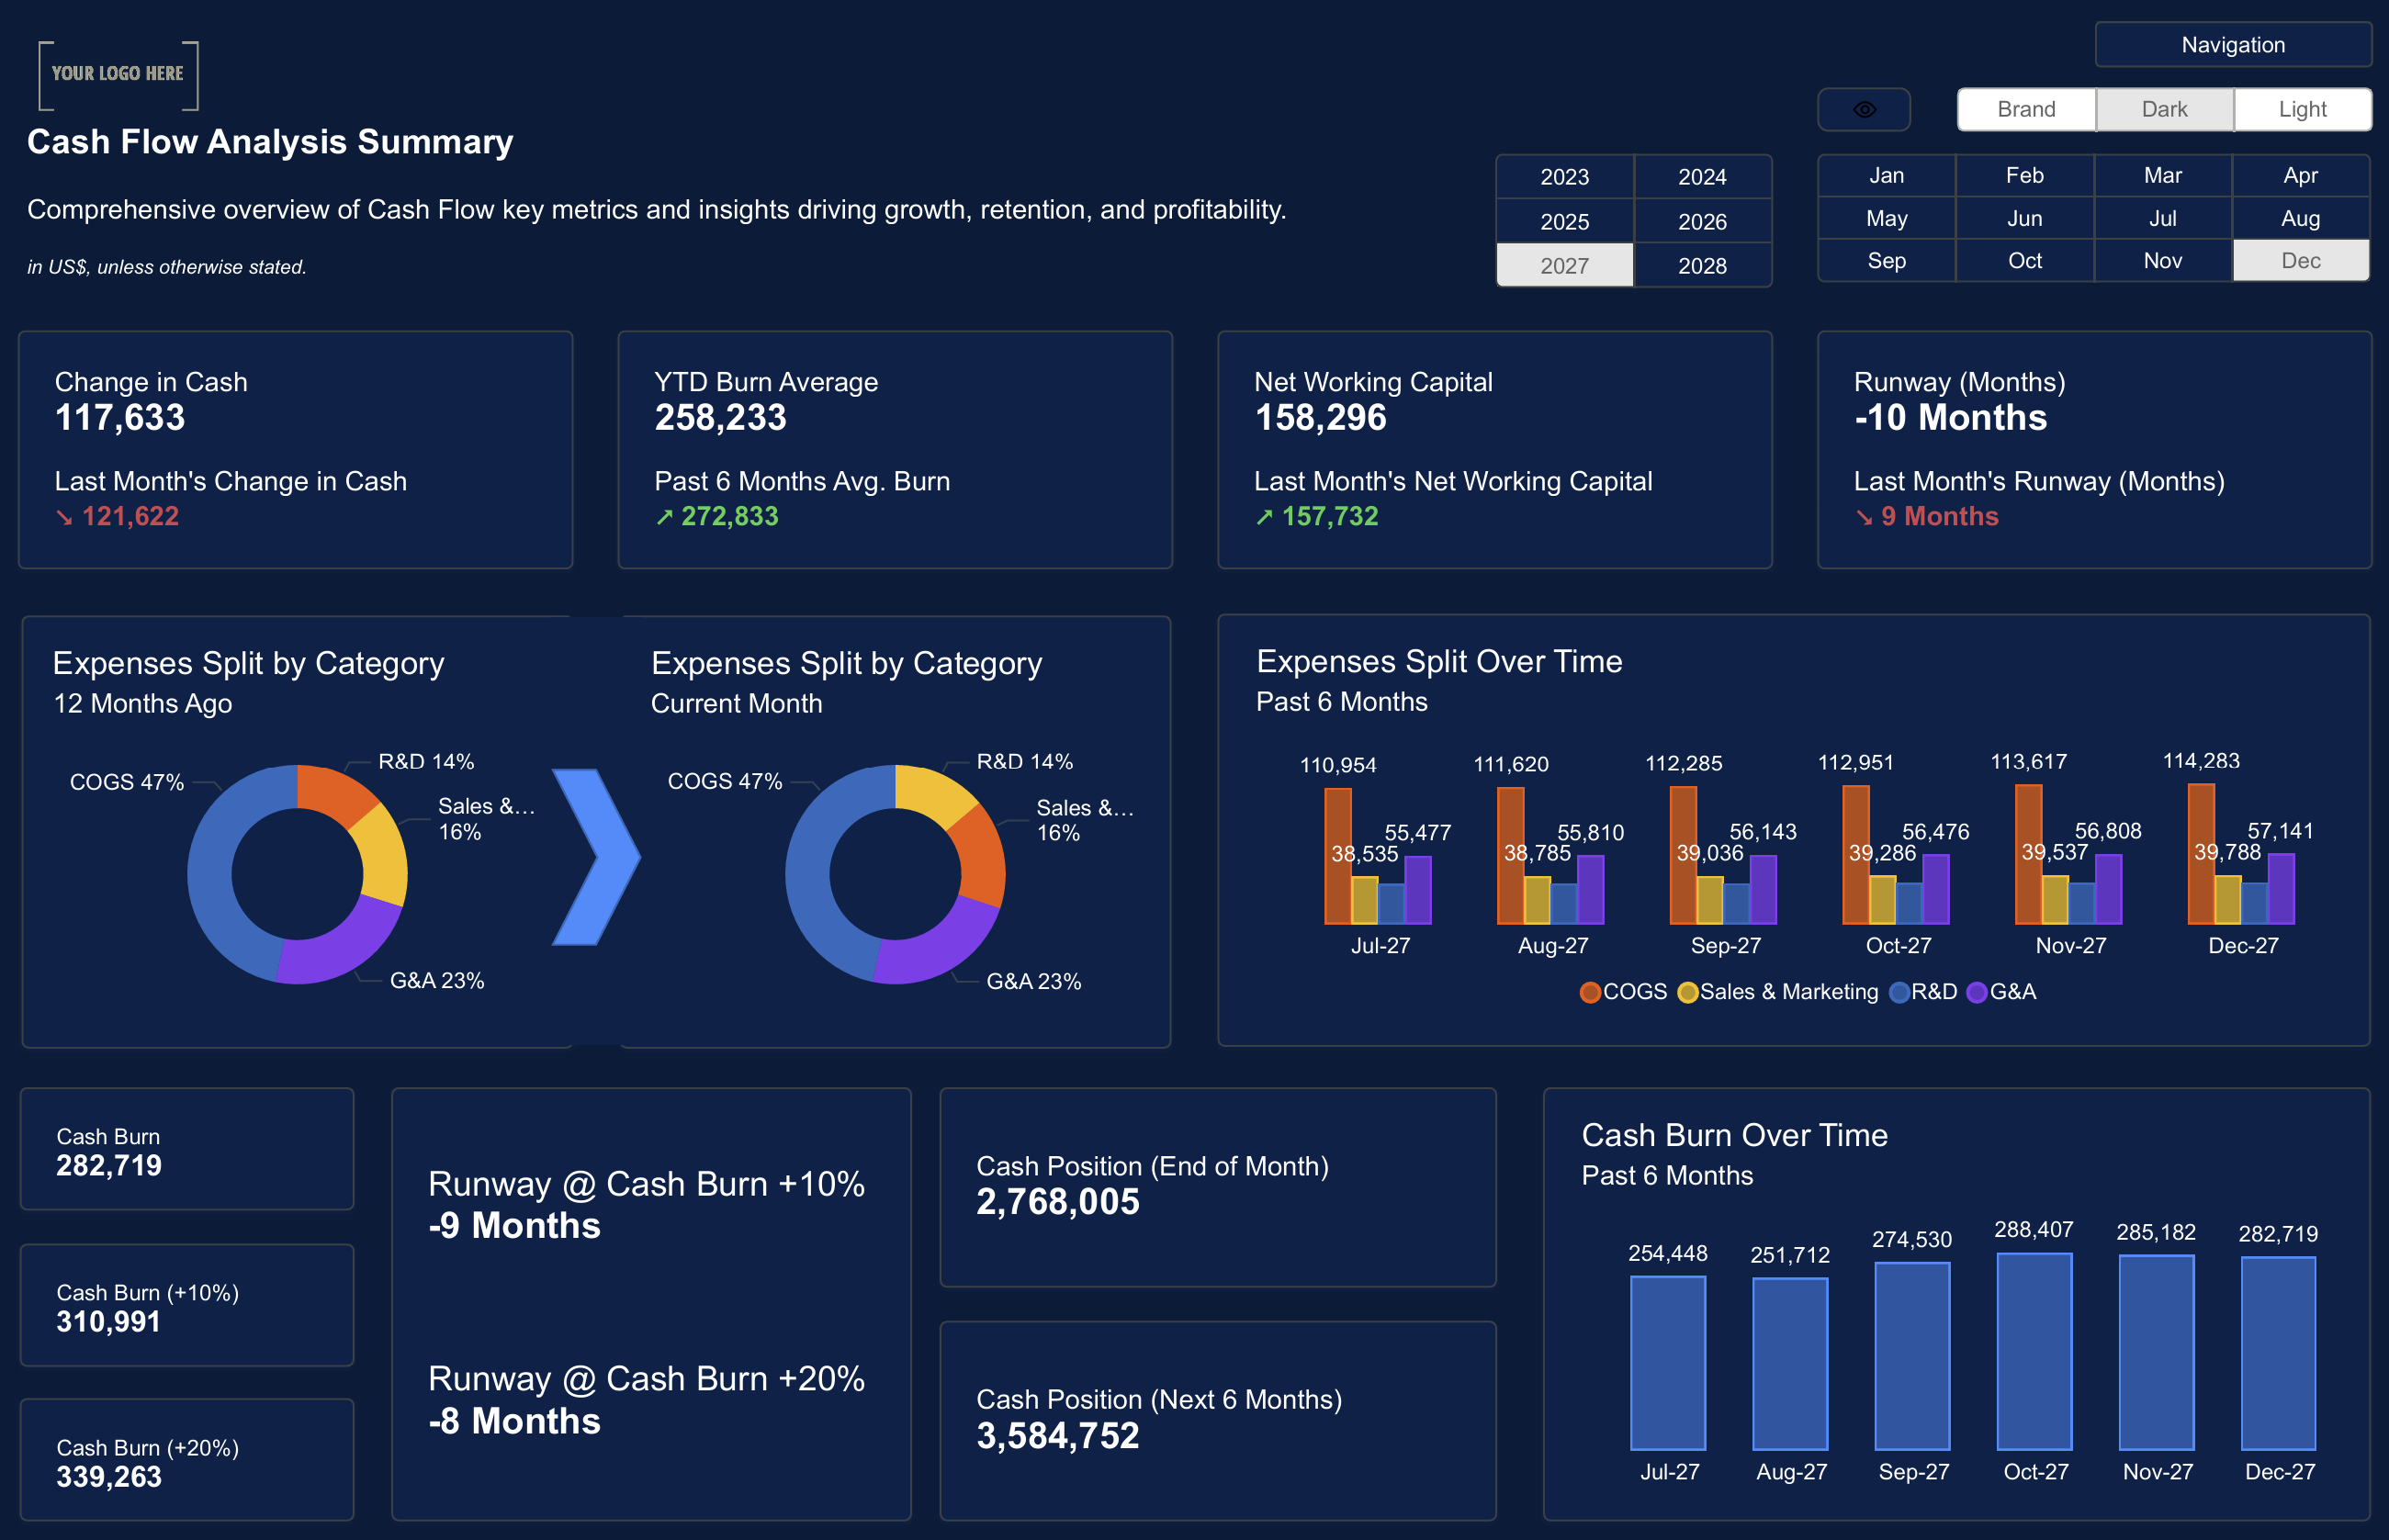
Creating a Power BI dashboard is one of the best ways to visualize data and share insights with your team. But if you’re new to Power BI, building a dashboard from scratch can feel overwhelming.
In this guide, we’ll take you through the step-by-step process of building an interactive Power BI dashboard, from importing your dataset to customizing visuals and sharing your dashboard.
Part 1: Importing Your Dataset into Power BI
Before you can start building your dashboard, you’ll need to import your dataset into Power BI Service. You can connect to various data sources, including:
- Excel files
- SQL databases
- Web APIs
- Cloud services
Steps to Import a Dataset:
- Sign in to Power BI Service at app.powerbi.com.
- Click on Get Data in the bottom-right corner.
- Choose your file type (e.g., Excel).
- Upload your dataset.
- Once imported, your dataset will appear in My Workspace.
 Power BI Data Modeling: Best Practices
Part 2: Creating Visuals for Your Dashboard
Once your dataset is loaded, it’s time to create visuals to display your data. Power BI offers a wide variety of visual types, including:
- Bar charts
- Line charts
- Donut charts
- Tables
How to Create a Visual:
- Open your dataset in Power BI Service.
- Click on New Report.
- Choose a visual type from the visualization pane.
- Drag your data fields into the visual.
- Customize the visual using the formatting options.

Part 3: Pinning Visuals to Your Dashboard
After creating your visuals, you can pin them to a dashboard to create an interactive, single-page experience.
Steps to Pin a Visual:
- Hover over your visual and click the pin icon.
- Choose Pin to Existing Dashboard or Create New Dashboard.
- Name your dashboard.
- Click Pin.
Once pinned, you can rearrange the tiles on your dashboard to create a custom layout.

Part 4: Customizing Your Dashboard Theme
Power BI allows you to customize the theme of your dashboard to align with your company’s branding or make it easier to read.
How to Change the Dashboard Theme:
- Go to your dashboard settings.
- Click on Dashboard Theme.
- Choose a predefined theme or create a custom theme.
- Apply the changes to see the new theme.

Part 5: Sharing Your Dashboard
Once your dashboard is complete, you can share it with your team to ensure that everyone has access to real-time insights.
How to Share a Dashboard:
- Click on the Share button at the top of your dashboard.
- Enter the email addresses of the people you want to share it with.
- Choose their access level (Viewer, Contributor, etc.).
- Click Send.
 Getting Started with Power BI Service – A Step-by-Step Guide
Building an interactive Power BI dashboard doesn’t have to be complicated. By following these step-by-step instructions, you can create engaging dashboards that help your team make better business decisions.
Ready to get started? Download our Power BI templates to build your own dashboards today!
Download our Power BI Templates now and start building interactive dashboards for your business.Get Started >
Subscribe to our newsletter
Stay ahead with the latest insights, tips, and trends in PowerBI and data visualization.
Join the network that is unlocking the full potential of their data - one dashboard at a time.


