
Power BI templates are a powerful tool for turning raw data into actionable insights. They save time, provide consistency, and enable businesses to track metrics with ease.
In this guide, we’ll explore:
- Why Power BI templates are essential
- 10 examples of inspiring templates for business needs
- How to maximize the value of templates in your reporting
Whether you’re tracking financial metrics, monitoring marketing campaigns, or analyzing operations, these templates will help you achieve better insights.
Why Use Power BI Templates?
Power BI templates simplify the reporting process by offering ready-made dashboards with pre-defined layouts, visuals, and metrics.
Benefits of Using Templates:
1️⃣ Time-Saving: Eliminate the need for designing from scratch.
2️⃣ Consistency: Maintain uniformity across all reports.
3️⃣ Scalability: Adapt templates to growing datasets and changing metrics.
Templates ensure businesses can focus on analyzing data rather than building visuals, making them an indispensable tool for teams of all sizes.

10 Inspiring Power BI Templates
1. Marketing Campaign Dashboard
- Track metrics like ad spend, click-through rates, and conversions.
- Great for managing multi-channel campaigns across Google Ads, Facebook Ads, and more.
2. SEO Performance Dashboard
- Analyze clicks, impressions, and keyword rankings from Google Search Console.
- Ideal for improving search visibility and organic traffic.
3. Sales Performance Dashboard
- Monitor sales funnels, conversion rates, and revenue by region or team.

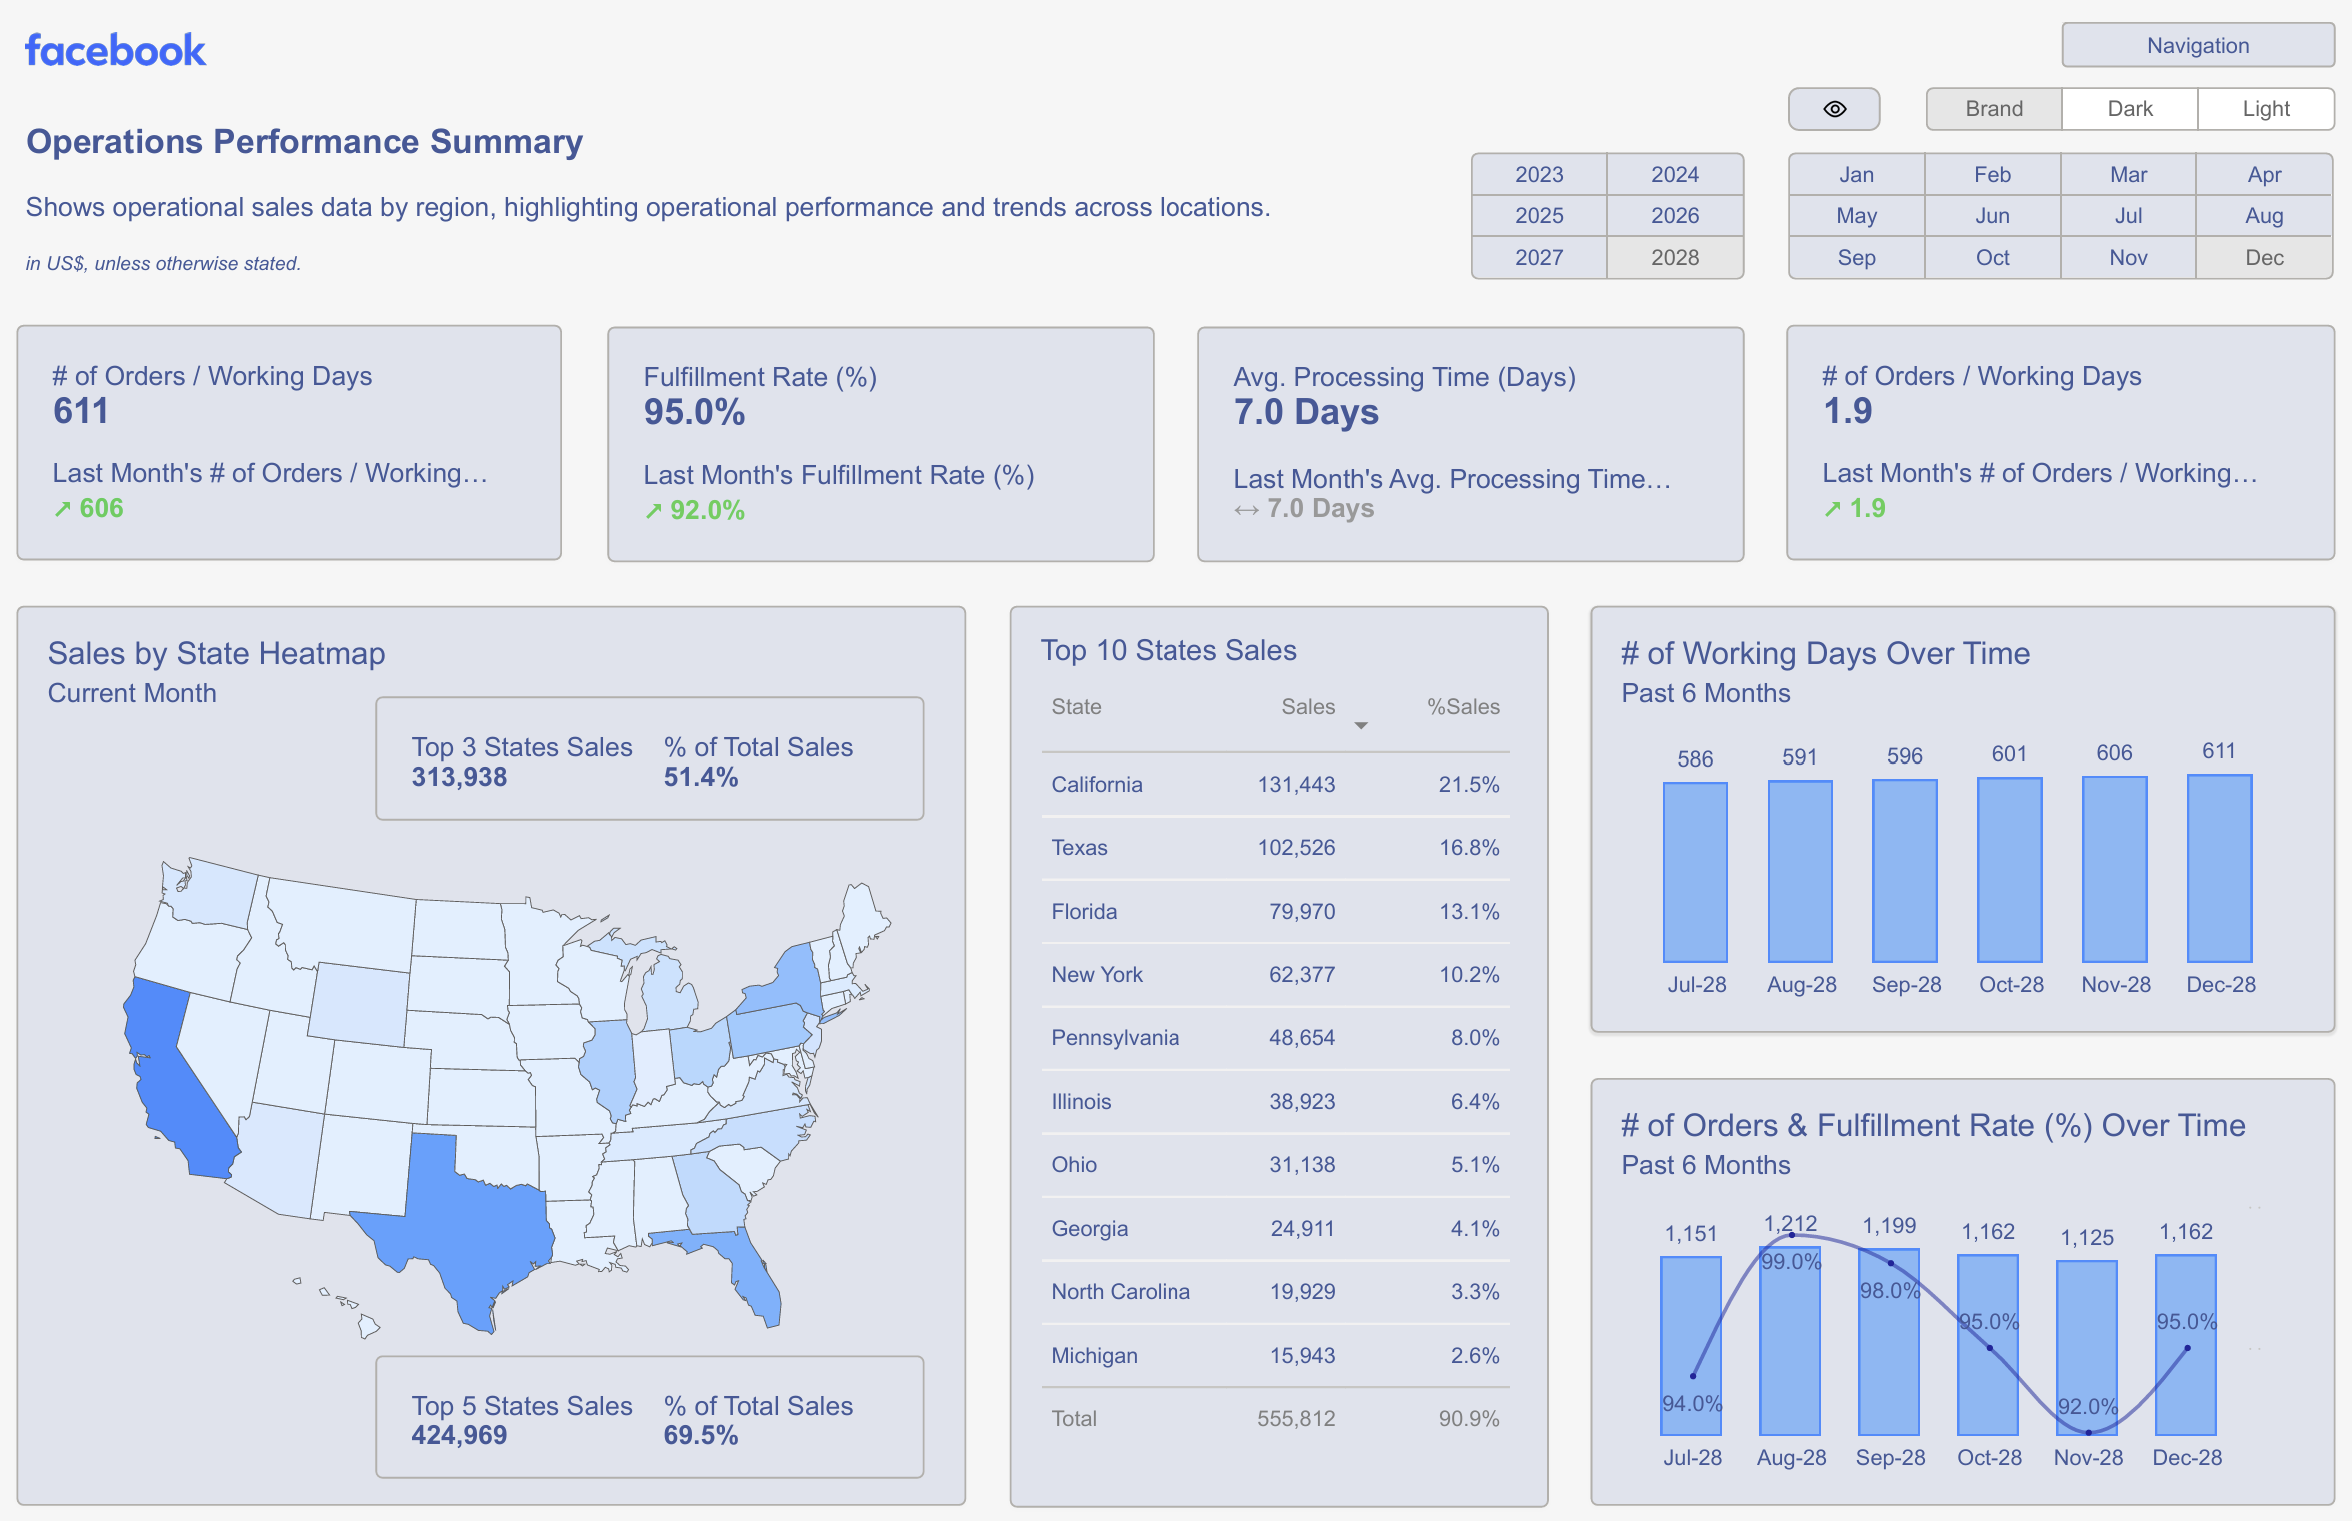
4. Operations Dashboard
- Track workflows, identify bottlenecks, and monitor operational KPIs.
5. Financial Health Dashboard
- Visualize profitability, expenses, and cash flow trends over time.
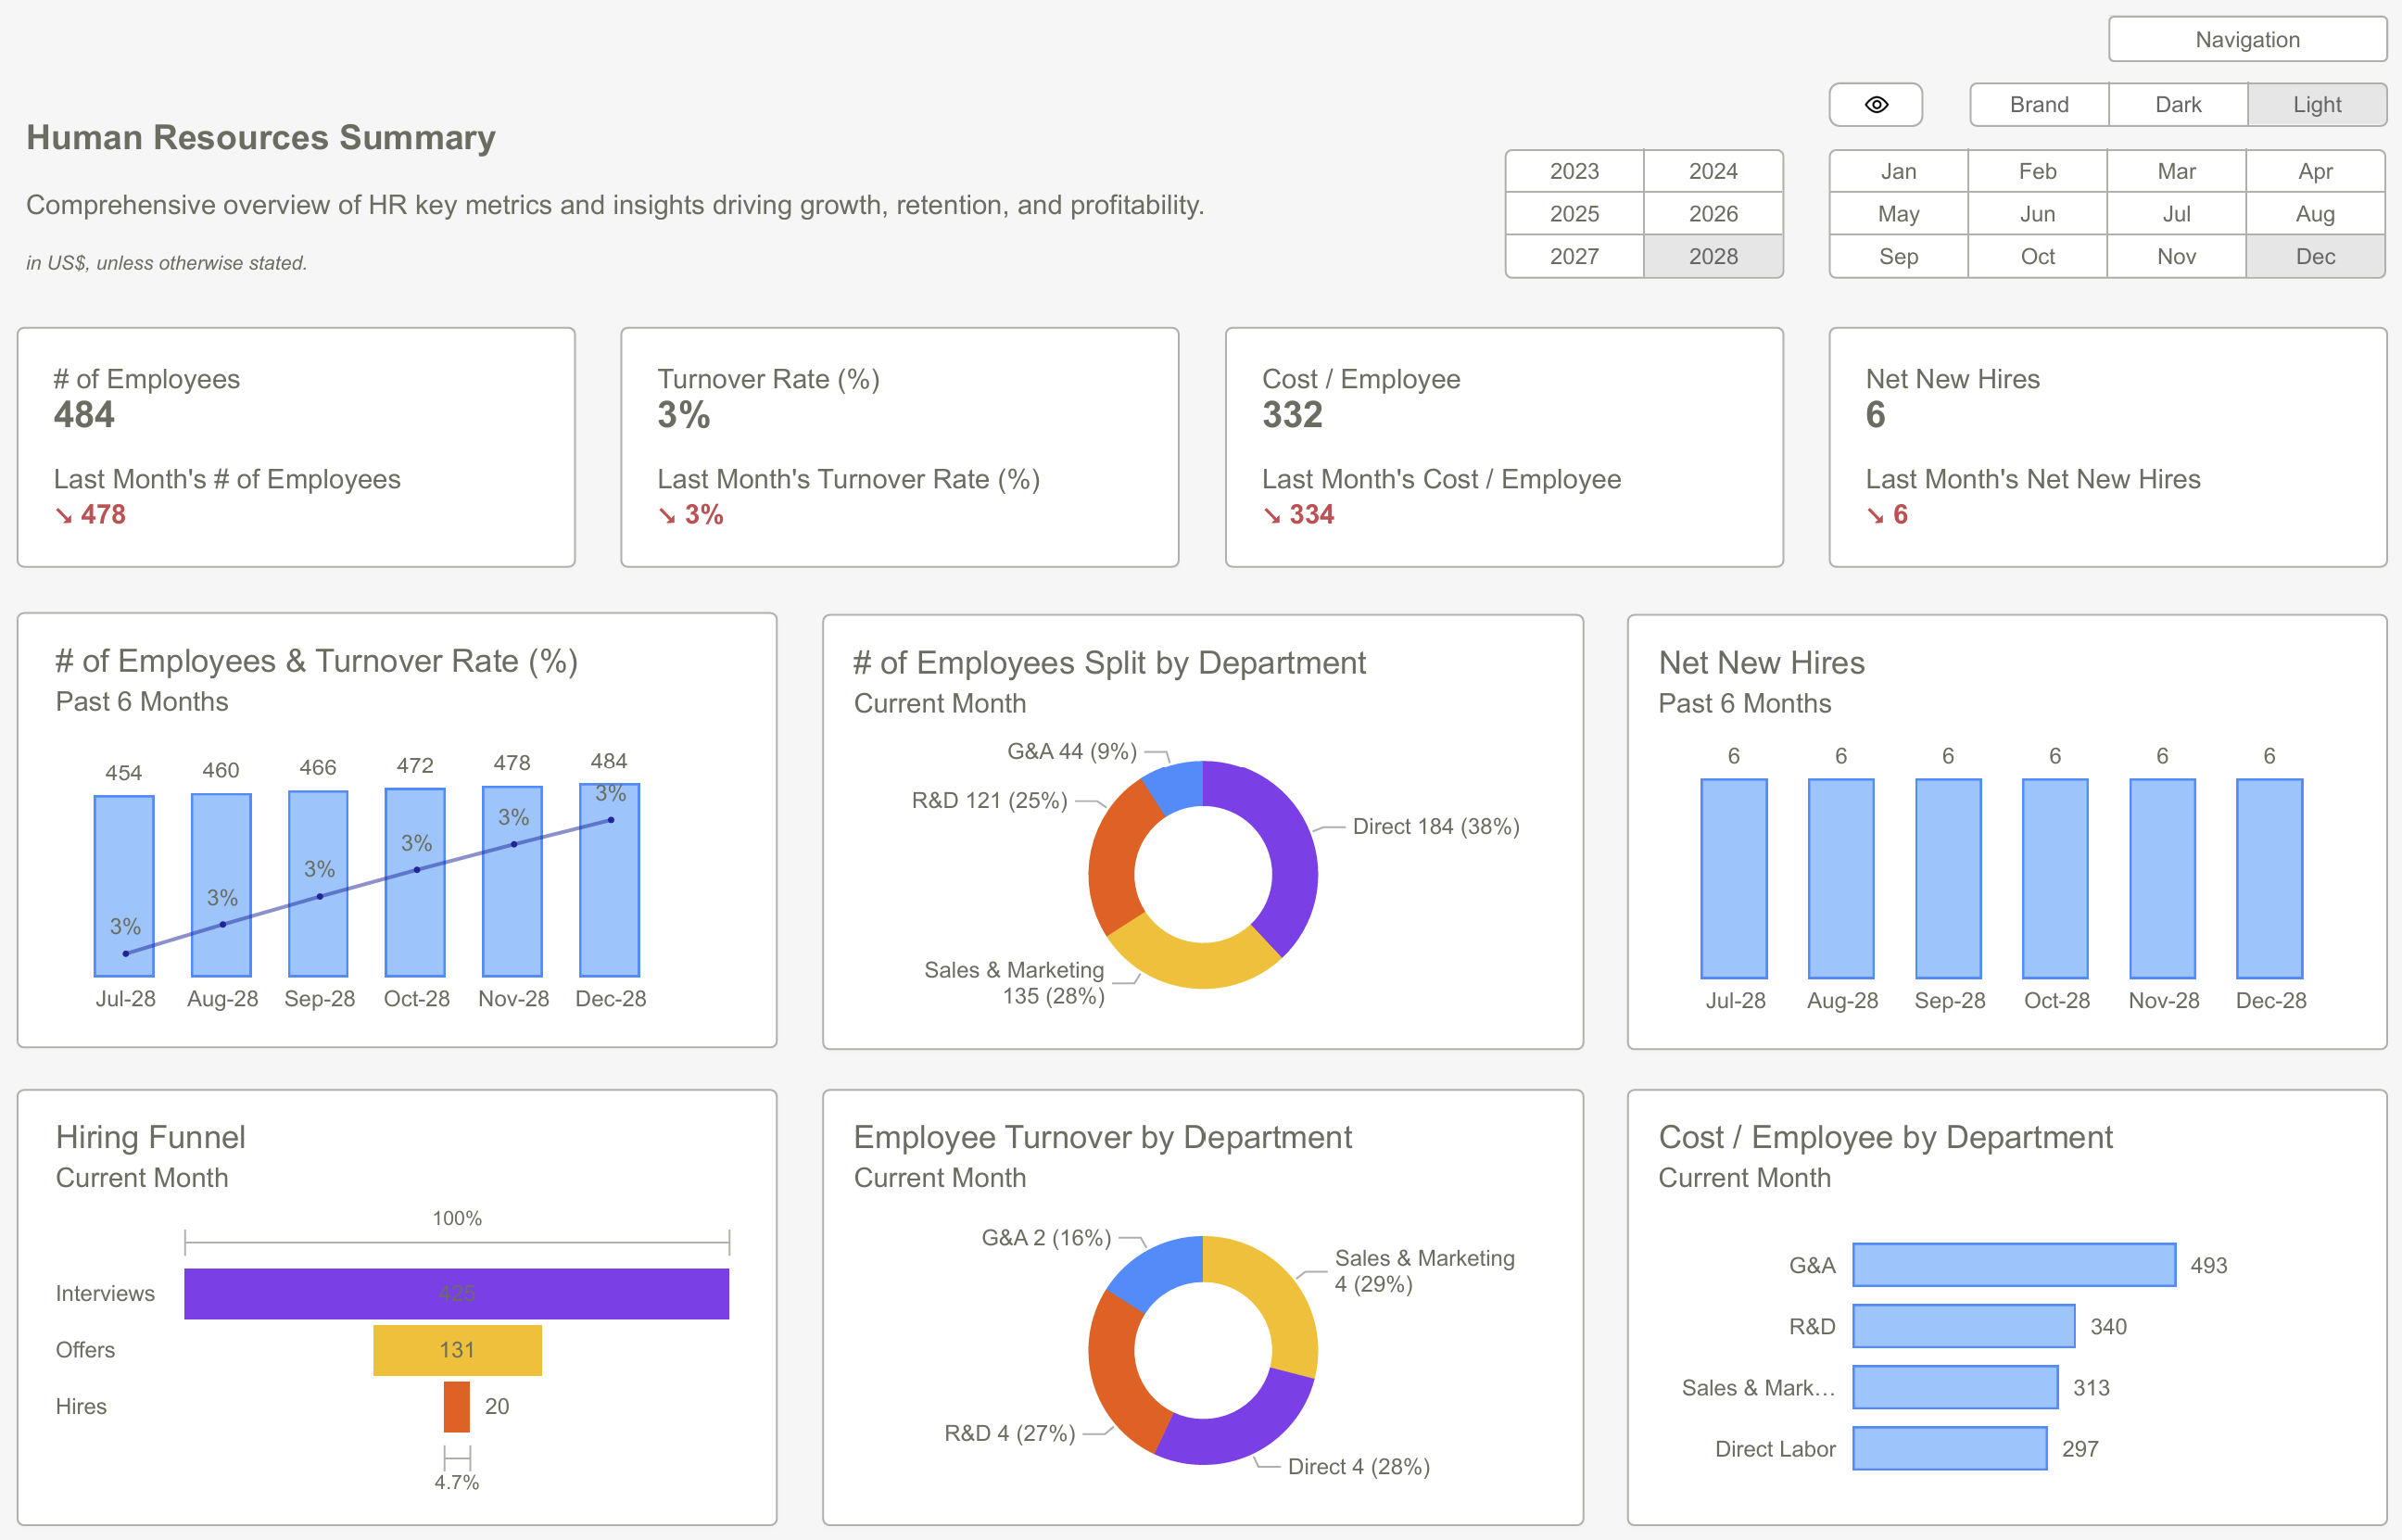
6. HR Analytics Dashboard
- Evaluate employee performance, turnover rates, and hiring trends.
7. SaaS Metrics Dashboard
- Track monthly recurring revenue (MRR), churn rates, and customer lifetime value.
8. Project Management Dashboard
- Monitor resource allocation, deadlines, and budget status for ongoing projects.
9. Ecommerce Analytics Dashboard
- Analyze cart abandonment, average order value, and sales trends.
10. Customer Support Dashboard
- Track open cases, response times, and customer satisfaction scores.

How to Maximize Template Value
While templates offer pre-built solutions, customization ensures they meet your unique business needs.
Tips for Customizing Templates:
1️⃣ Align with Branding: Add your company’s logo and colors.
2️⃣ Add Key Metrics: Focus on KPIs most relevant to your goals.
3️⃣ Automate Updates: Link templates to live data sources for real-time insights.
Common Mistakes to Avoid
Avoid these pitfalls to get the most out of your Power BI templates:
1️⃣ Overloading Dashboards: Stick to essential visuals for clarity.
2️⃣ Neglecting Data Quality: Ensure clean and accurate data inputs.
3️⃣ Skipping User Training: Train your team to use dashboards effectively.
 How to Leverage Power BI Templates for Marketing Analytics
Power BI templates simplify reporting and unlock the potential of data-driven decision-making. By leveraging templates tailored to your business needs, you can save time, improve accuracy, and gain valuable insights.
Ready to transform your reporting? Explore our Power BI templates and elevate your analytics today!
Download our Power BI Templates now and take your reporting to the next level.Get Started >
Subscribe to our newsletter
Stay ahead with the latest insights, tips, and trends in PowerBI and data visualization.
Join the network that is unlocking the full potential of their data - one dashboard at a time.
Related posts
Explore more insights and tips with these related posts curated just for you.

Why Power BI Reporting Dashboards Are Key to Scaling Small Businesses?

Power BI Dashboard Examples: Essential Design Patterns That Users Love [2025 Guide]
