
Creating professional Power BI dashboards can be time-consuming, especially when you need to tailor them for specific business functions like finance, sales, and operations. That’s why using Power BI dashboard templates is a smart solution for businesses of all sizes.
In this guide, we’ll explore the best Power BI dashboard templates for finance, sales, and operations. These templates will help you save time, improve data visualization, and enhance decision-making across your organization.
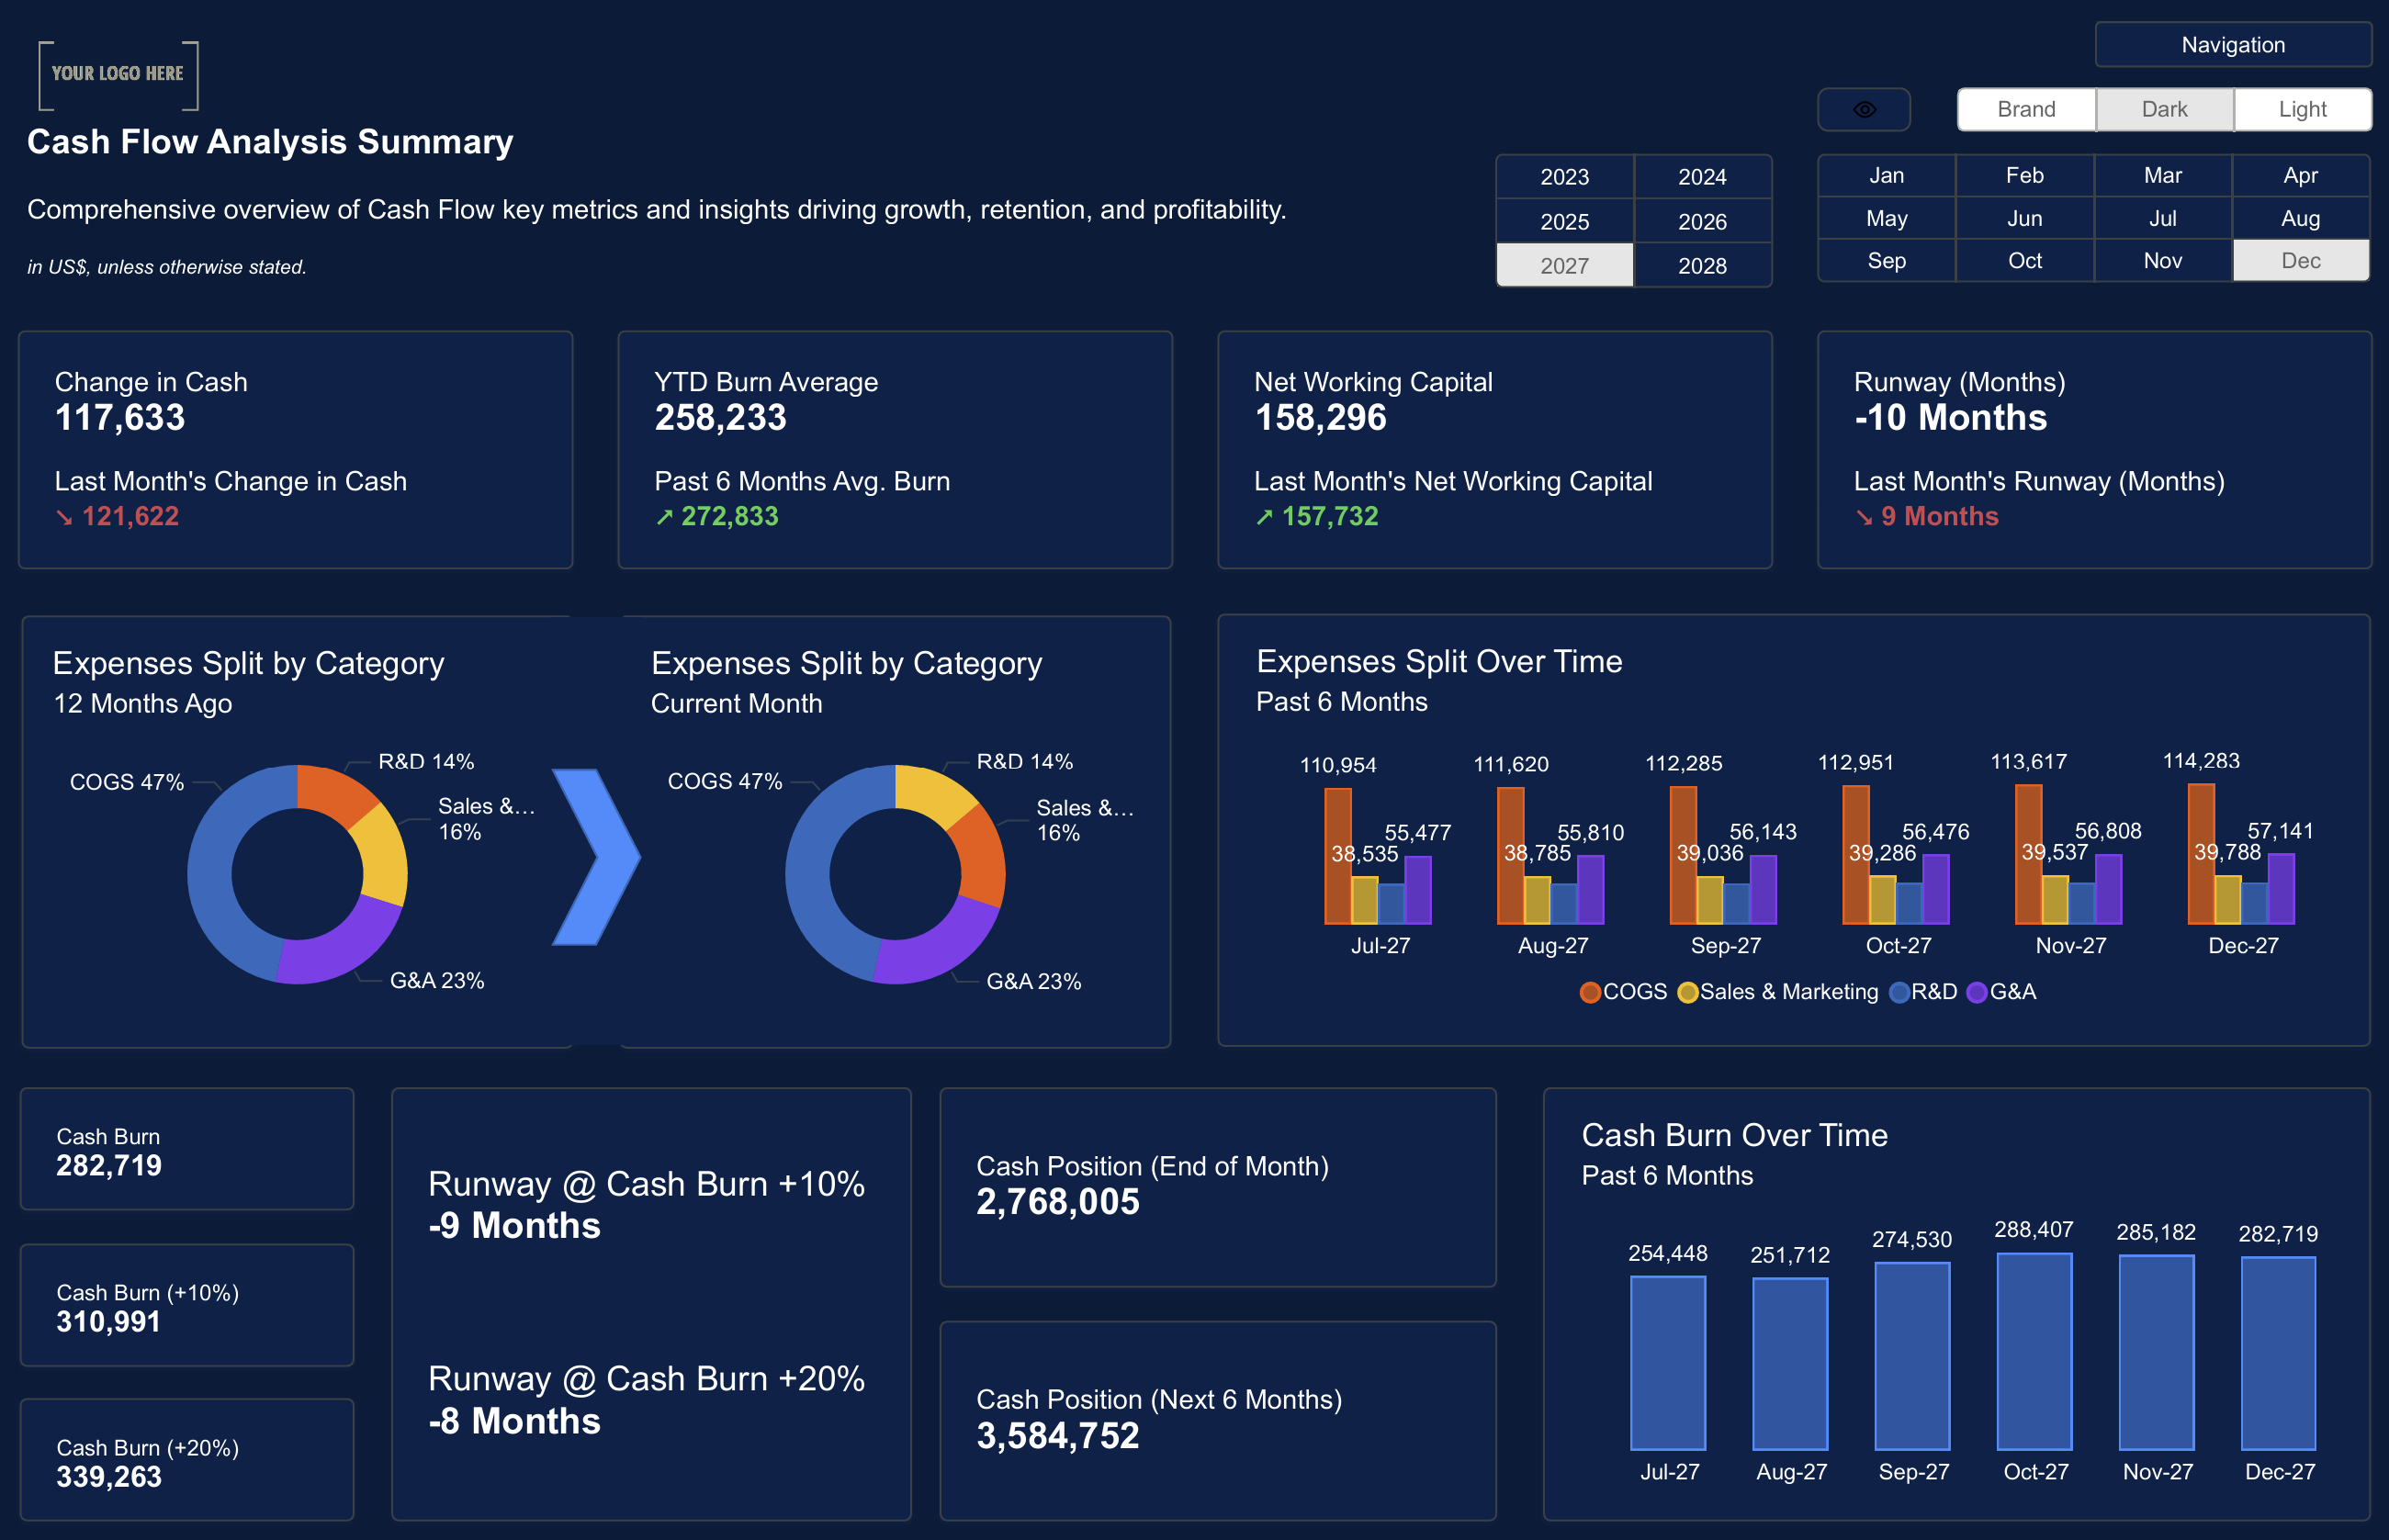
A Finance Dashboard Template in Power BI helps you track cash flow, monitor expenses, and analyze financial performance. It’s essential for CFOs, accountants, and finance teams who need to manage budgets effectively.
Key Metrics to Include:
- Monthly revenue and expenses
- Profit margins
- Cash inflows and outflows
- Financial forecasts
Tip: Use a Cash Flow Dashboard Template to keep track of your company’s financial health in real time.
 How to Create Stunning Power BI Reports Using Templates
Sales Dashboard Templates
A Sales Dashboard Template is perfect for sales managers and executives who need to track sales performance and pipeline progress.
Key Metrics to Include:
- Total revenue
- Sales pipeline status
- Conversion rates
- Customer acquisition costs
Tip: A Sales Performance Dashboard Template can help you quickly identify growth opportunities and performance gaps.

Operations Dashboard Templates
An Operations Dashboard Template is designed to help operations managers monitor workflow efficiency, task completion rates, and department performance.
Key Metrics to Include:
- Task completion rates
- Productivity by department
- Workflow timelines
- Operational KPIs
Tip: Use an Operations Report Template to keep your team on track and ensure that key deadlines are met.

Marketing Dashboard Templates
A Marketing Dashboard Template helps track the performance of marketing campaigns, lead generation, and ROI.
Key Metrics to Include:
- Campaign ROI
- Lead conversion rates
- Click-through rates (CTR)
- Cost per lead
Tip: Use a Dark Mode Dashboard to reduce screen fatigue during long analytics sessions.

Customizing Your Power BI Templates
While pre-built Power BI templates save time, it’s essential to customize them to fit your specific business needs.
Customization Tips:
- Update colors and fonts to match your company’s branding.
- Add filters to allow users to explore data in different ways.
- Adjust visuals to highlight the most important metrics.
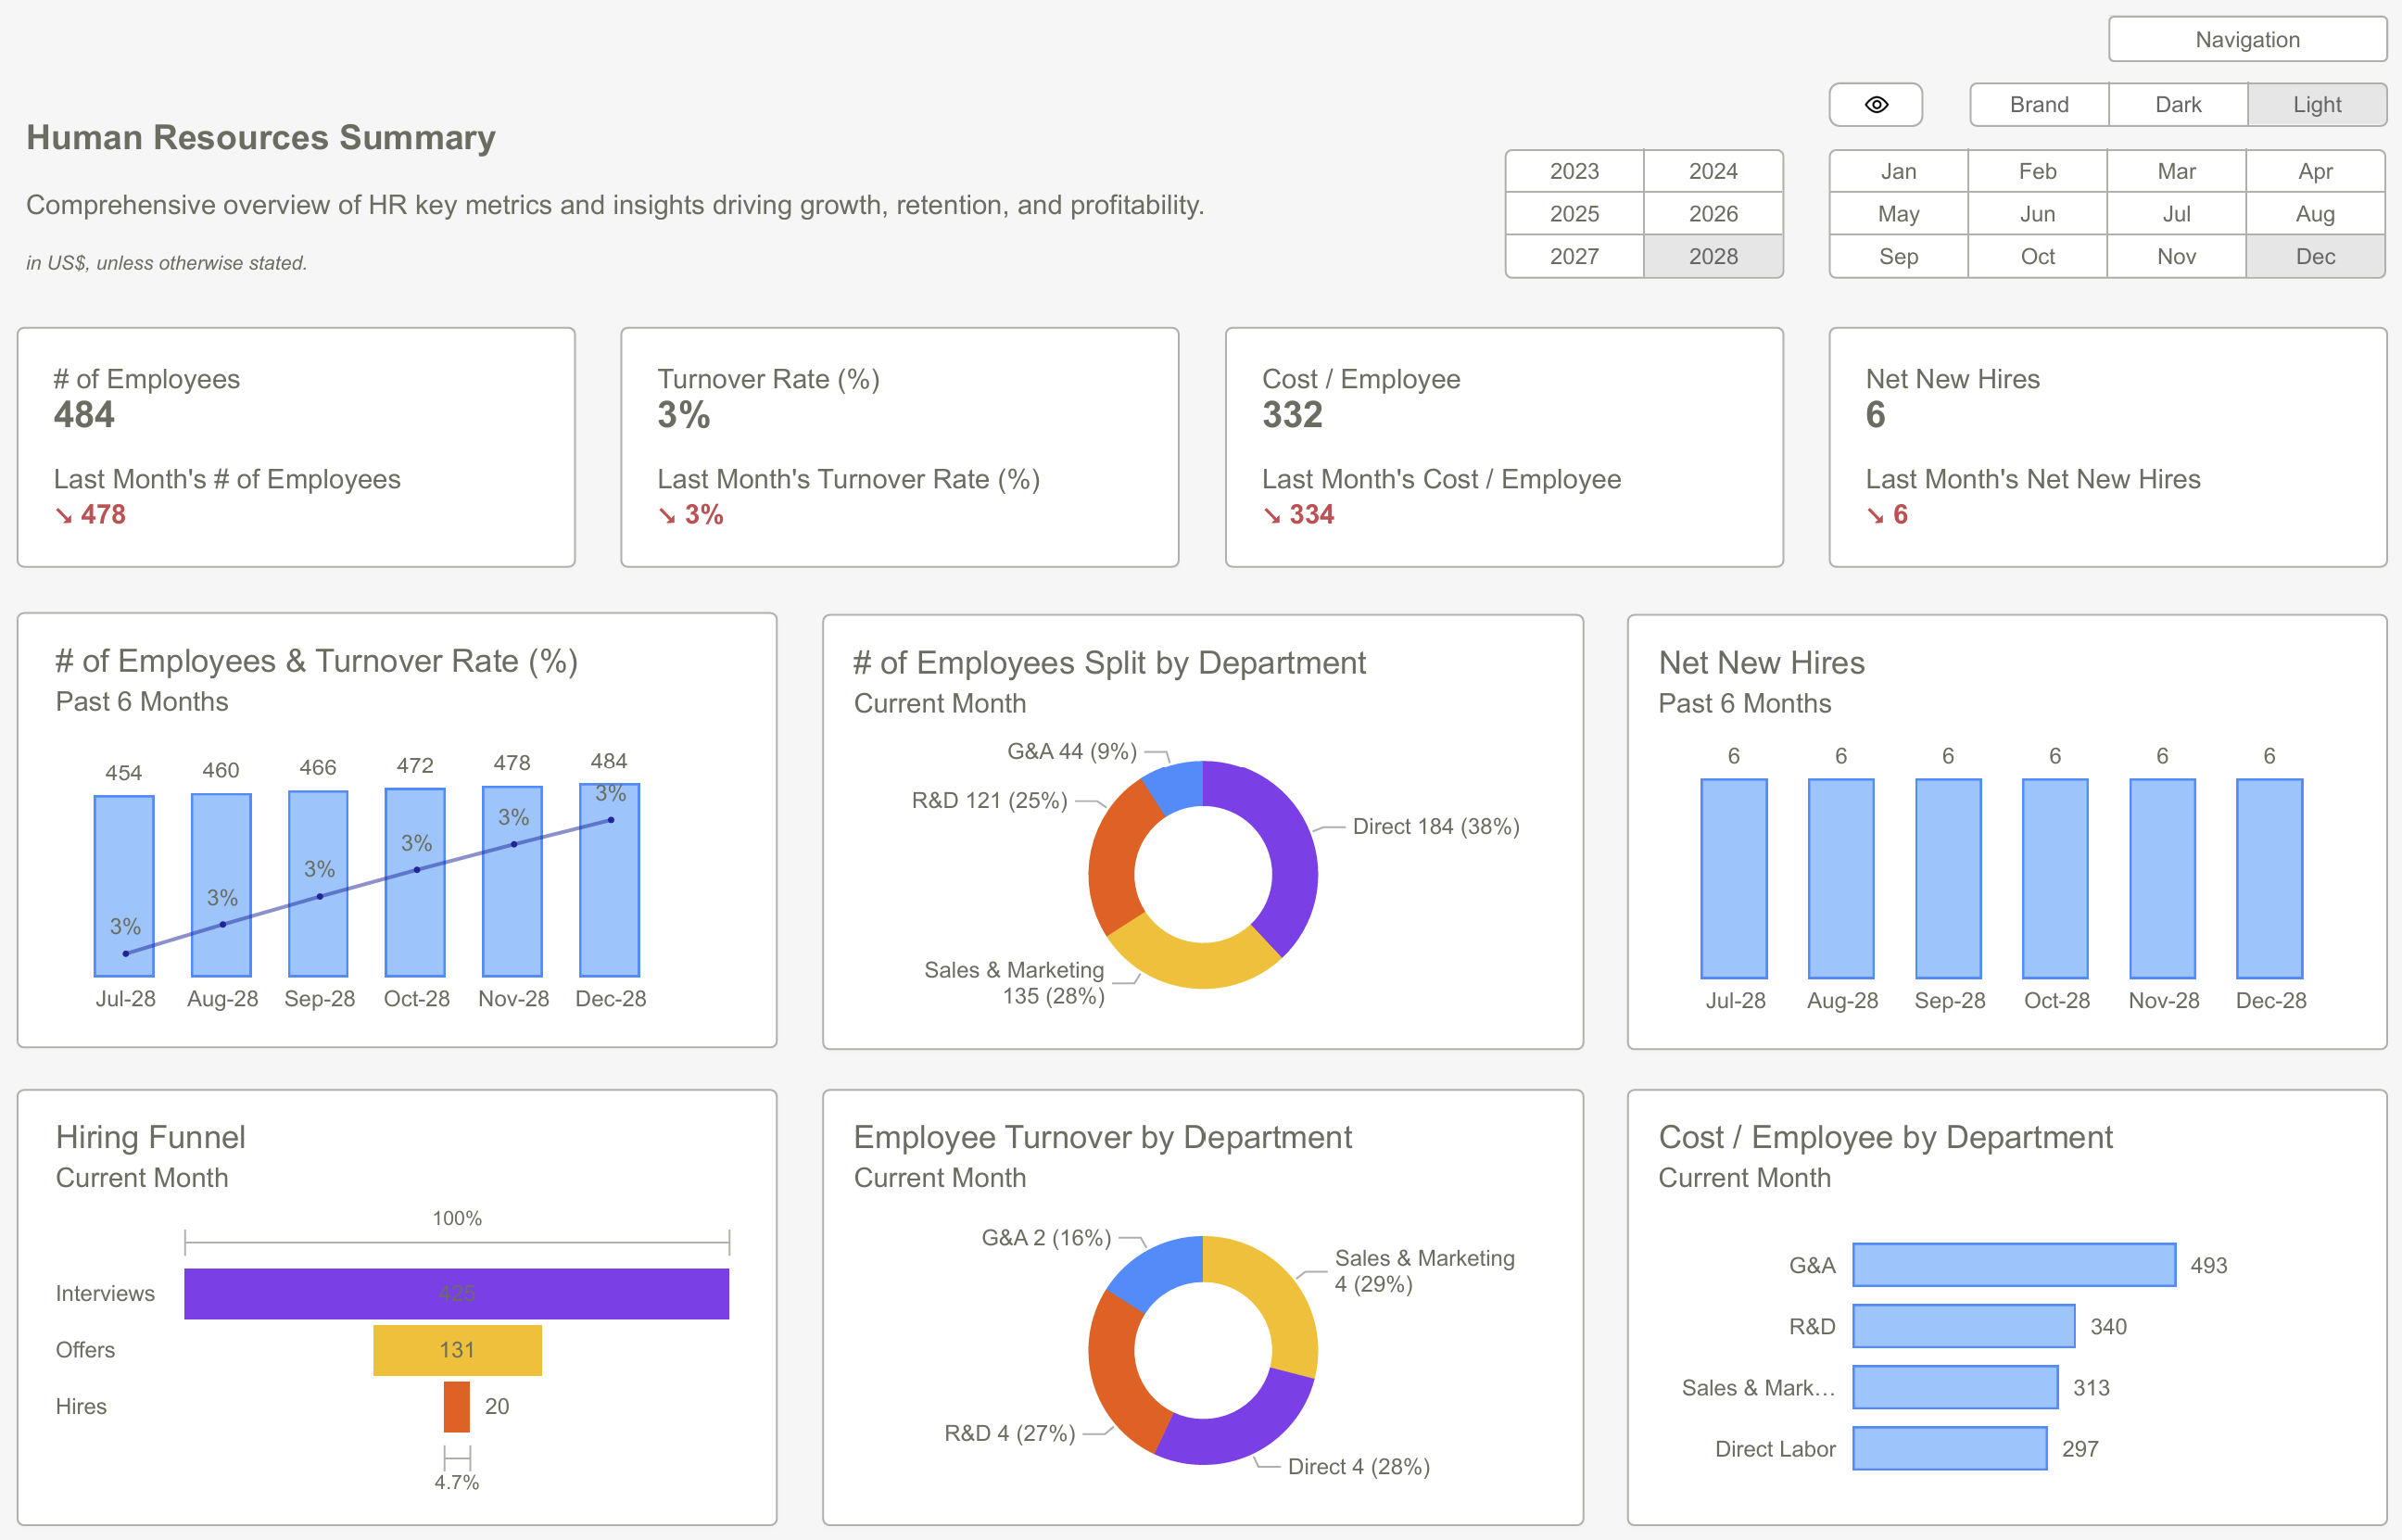 Top Power BI Dashboards for HR Reporting and Employee Analytics
Conclusion (Rich Text Field)
Using Power BI dashboard templates is a great way to save time and improve your reporting. Whether you’re managing finance, sales, operations, or marketing, the right templates will help you visualize data and make better decisions.
Ready to get started? Download our templates and start creating professional dashboards today!
Download our Power BI Templates now and start building impactful dashboards for your business.Get Started >
Subscribe to our newsletter
Stay ahead with the latest insights, tips, and trends in PowerBI and data visualization.
Join the network that is unlocking the full potential of their data - one dashboard at a time.
Related posts
Explore more insights and tips with these related posts curated just for you.

Mastering the PowerBI Dashboard: Essential Tips for Effective Design

Why Power BI Reporting Dashboards Are Key to Scaling Small Businesses?
