
Reporting is essential to decision-making at every level of an organization. For executives, concise and actionable insights are critical to evaluating performance and planning future strategies. Similarly, quarterly and annual summaries are pivotal for periodic performance reviews.
With Power BI dashboards, you can automate and simplify these processes, delivering high-level overviews tailored to your business needs.
In this guide, we’ll explore:
- The importance of executive and periodic reporting
- Top Power BI dashboards for high-level summaries
- Best practices for customizing these templates
The Importance of Executive and Periodic Reporting
Executive and periodic reporting provides key stakeholders with an overview of performance, helping to identify trends, challenges, and opportunities.
Benefits of High-Level Dashboards:
1️⃣ Strategic Oversight: Quickly evaluate KPIs that align with company goals.
2️⃣ Data Accuracy: Use dynamic dashboards for real-time insights.
3️⃣ Time Efficiency: Automate repetitive reporting tasks with pre-built templates.
 Power BI Dashboard
Top Power BI Dashboards for Executive Reporting
Here are three must-have dashboards for streamlined executive and periodic reporting:
1. Executive Summary Dashboard
- Provides a snapshot of organizational performance across departments.
- Ideal for presenting to C-level stakeholders.
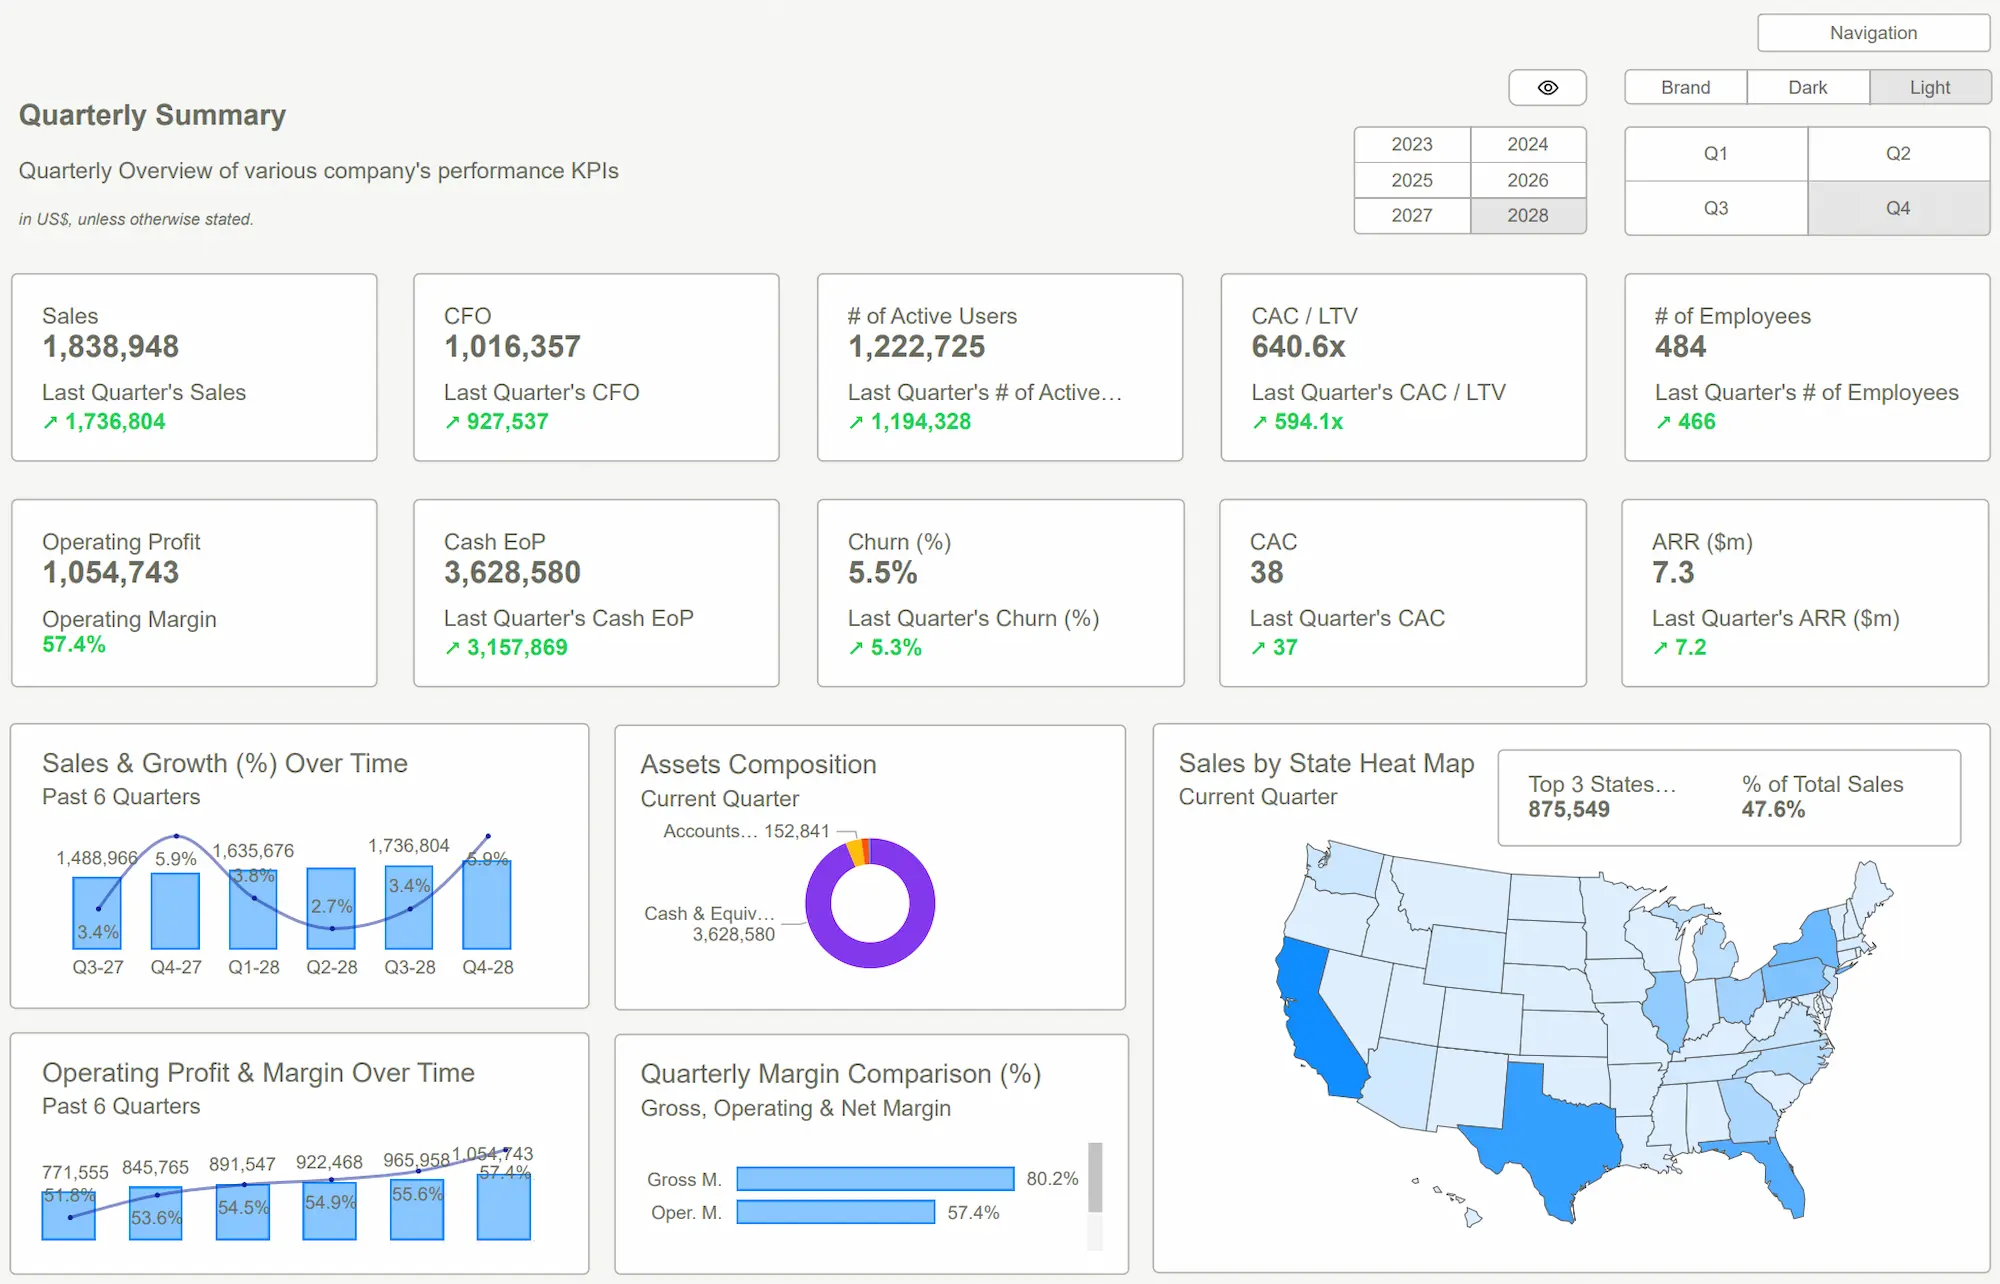
2. Quarterly Summary Dashboard
- Tracks performance over three months, highlighting trends and outliers.
- Great for operational reviews and planning sessions.
3. Annual Summary Dashboard
- Offers a comprehensive look at year-to-date performance.
- Useful for financial reviews and board meetings.
Customizing Dashboards for High-Level Reporting
Tailoring dashboards to your organization’s needs ensures they deliver maximum value.
Steps to Customize:
1️⃣ Focus on Key Metrics: Include only the most relevant KPIs, such as revenue growth or net profit margins.
2️⃣ Use Consistent Visuals: Ensure all dashboards use uniform color schemes and chart types for clarity.
3️⃣ Automate Data Refreshes: Connect dashboards to live data sources for real-time updates.

Overcoming Challenges in Executive Reporting
Even with advanced dashboards, challenges like data overload and poor visualization can hinder reporting.
Solutions to Common Problems:
1️⃣ Simplify Complex Data: Break down large datasets into digestible visuals.
2️⃣ Standardize Reporting Formats: Create templates that align with your organization’s style guide.
3️⃣ Train Users: Ensure your team understands how to navigate and interpret dashboards.
How to Maximize the Value of Power BI Dashboards
Tips for Long-Term Success:
- Set Clear Goals: Define what each dashboard should achieve, such as identifying risks or opportunities.
- Iterate Regularly: Continuously improve dashboards based on feedback.
- Promote Accessibility: Ensure dashboards are easy to access and understand across teams.
 Power BI Dashboard Examples
Power BI dashboards for executive, quarterly, and annual reporting enable organizations to deliver high-impact insights with minimal effort. By leveraging templates designed for high-level summaries, you can save time, enhance accuracy, and improve strategic decision-making.
Ready to streamline your reporting? Download our templates and revolutionize your executive reporting today!
Download our Power BI Templates now and simplify your executive reporting with actionable insights.Get Started >
Subscribe to our newsletter
Stay ahead with the latest insights, tips, and trends in PowerBI and data visualization.
Join the network that is unlocking the full potential of their data - one dashboard at a time.
Related posts
Explore more insights and tips with these related posts curated just for you.

Top 10 Power BI Dashboard Examples to Boost Business Insights

Mastering the Power BI Dashboard: Essential Tips for Effective Design
