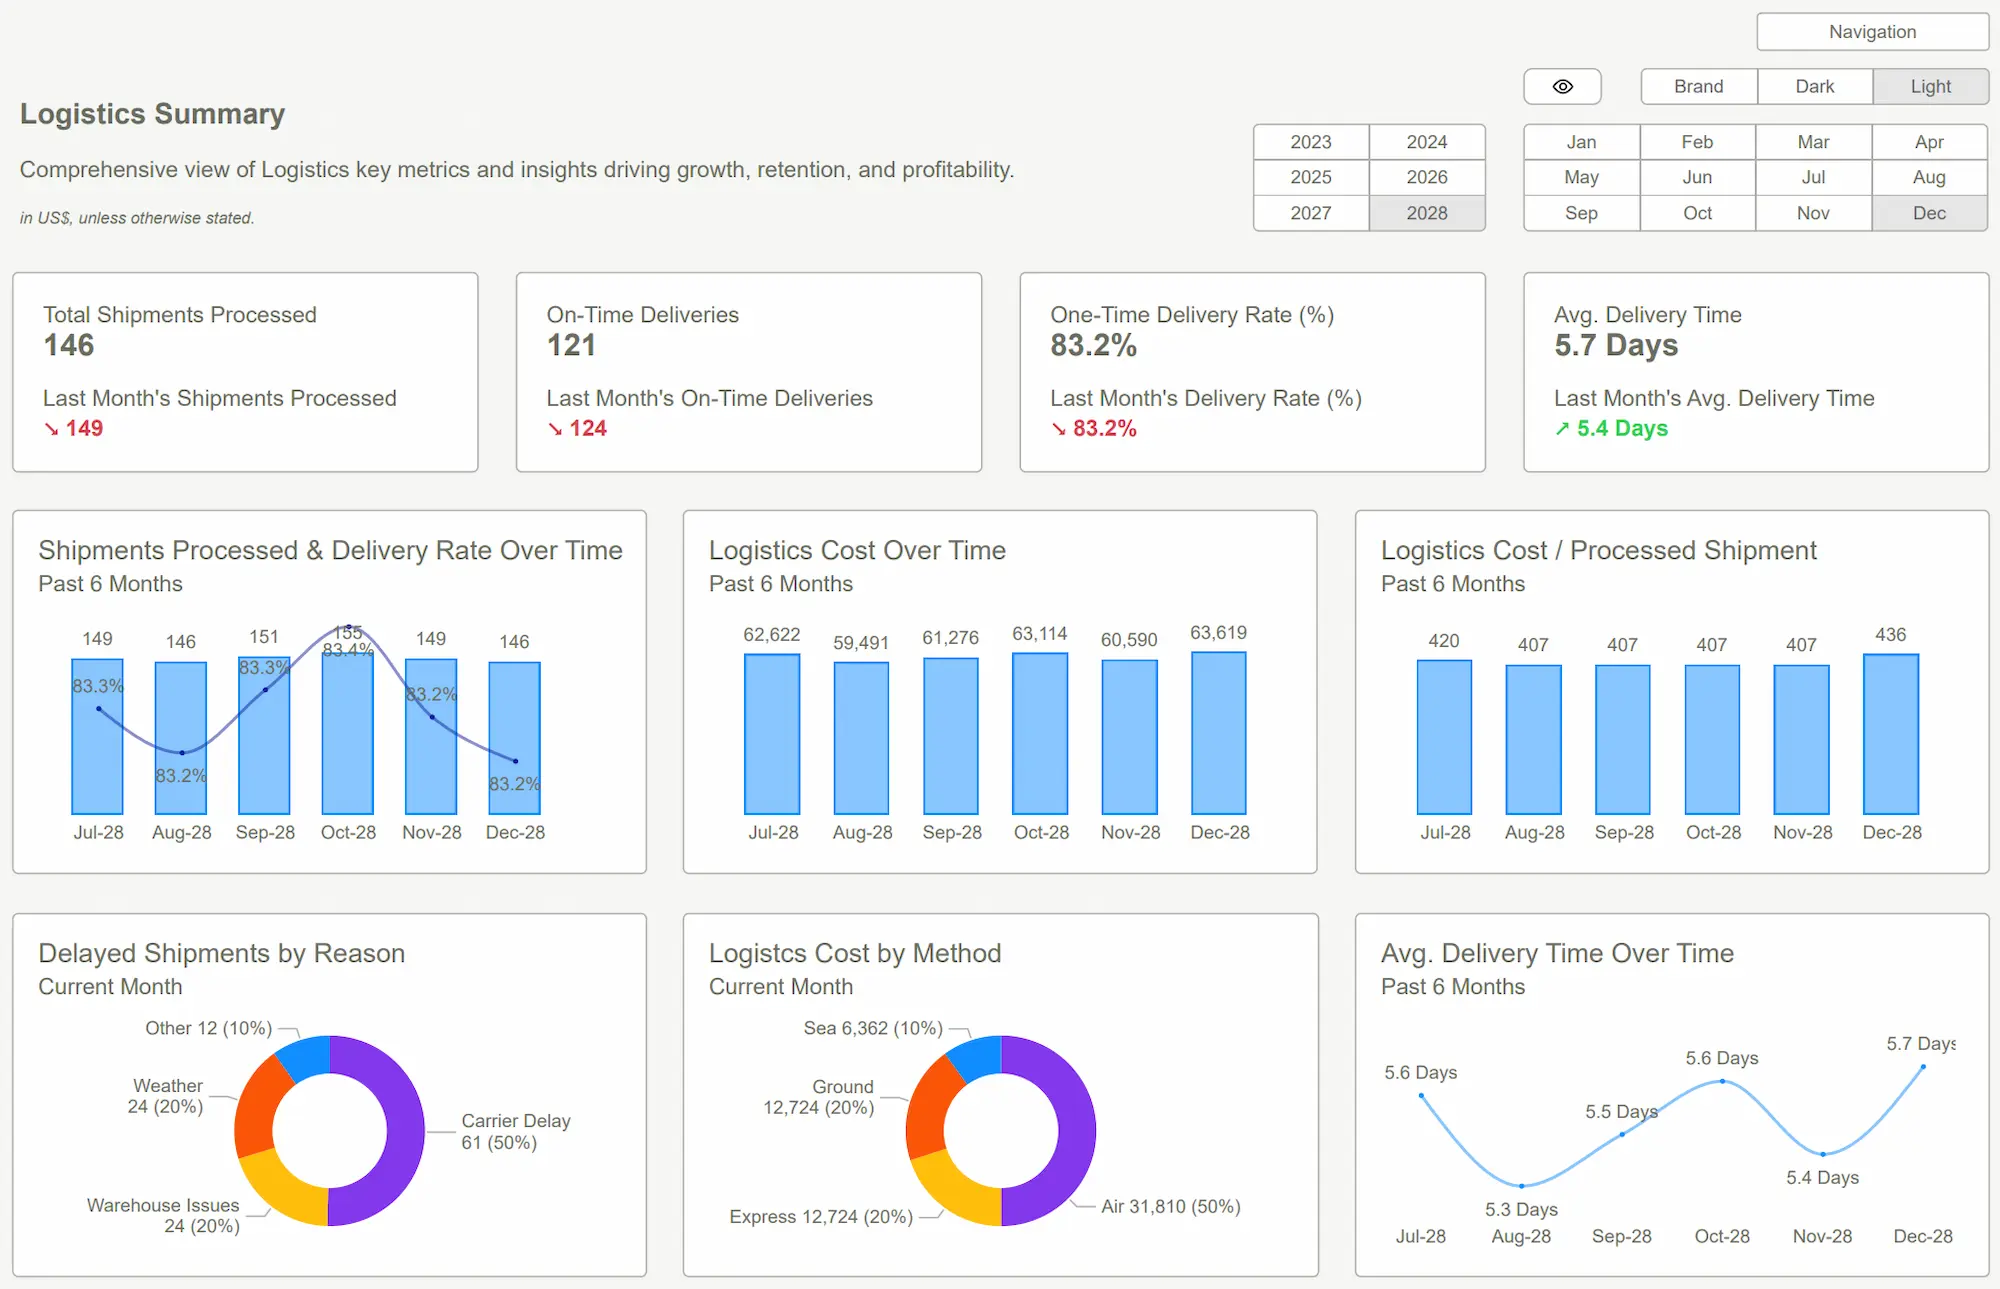
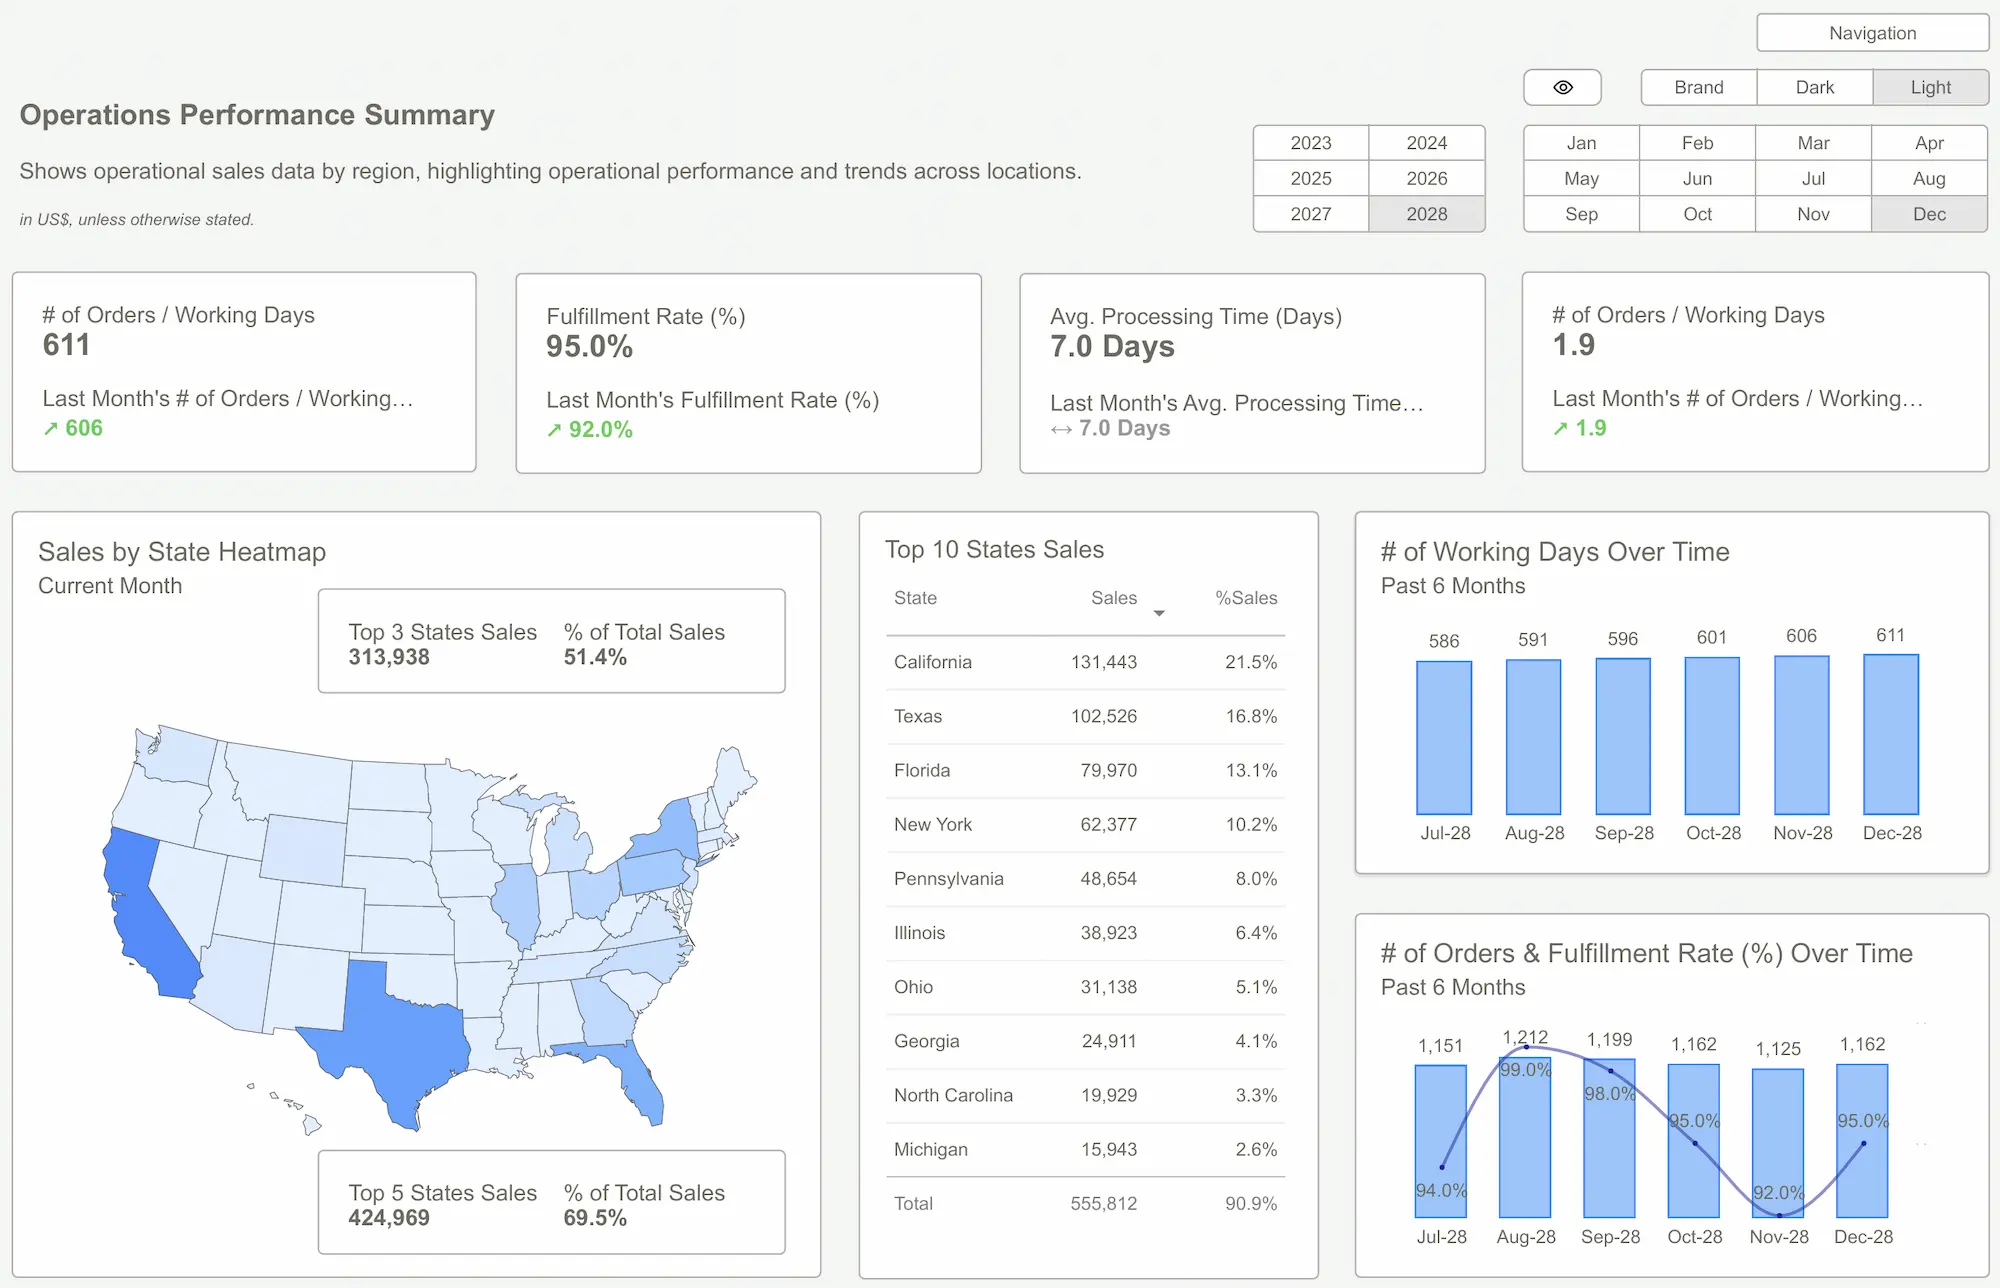
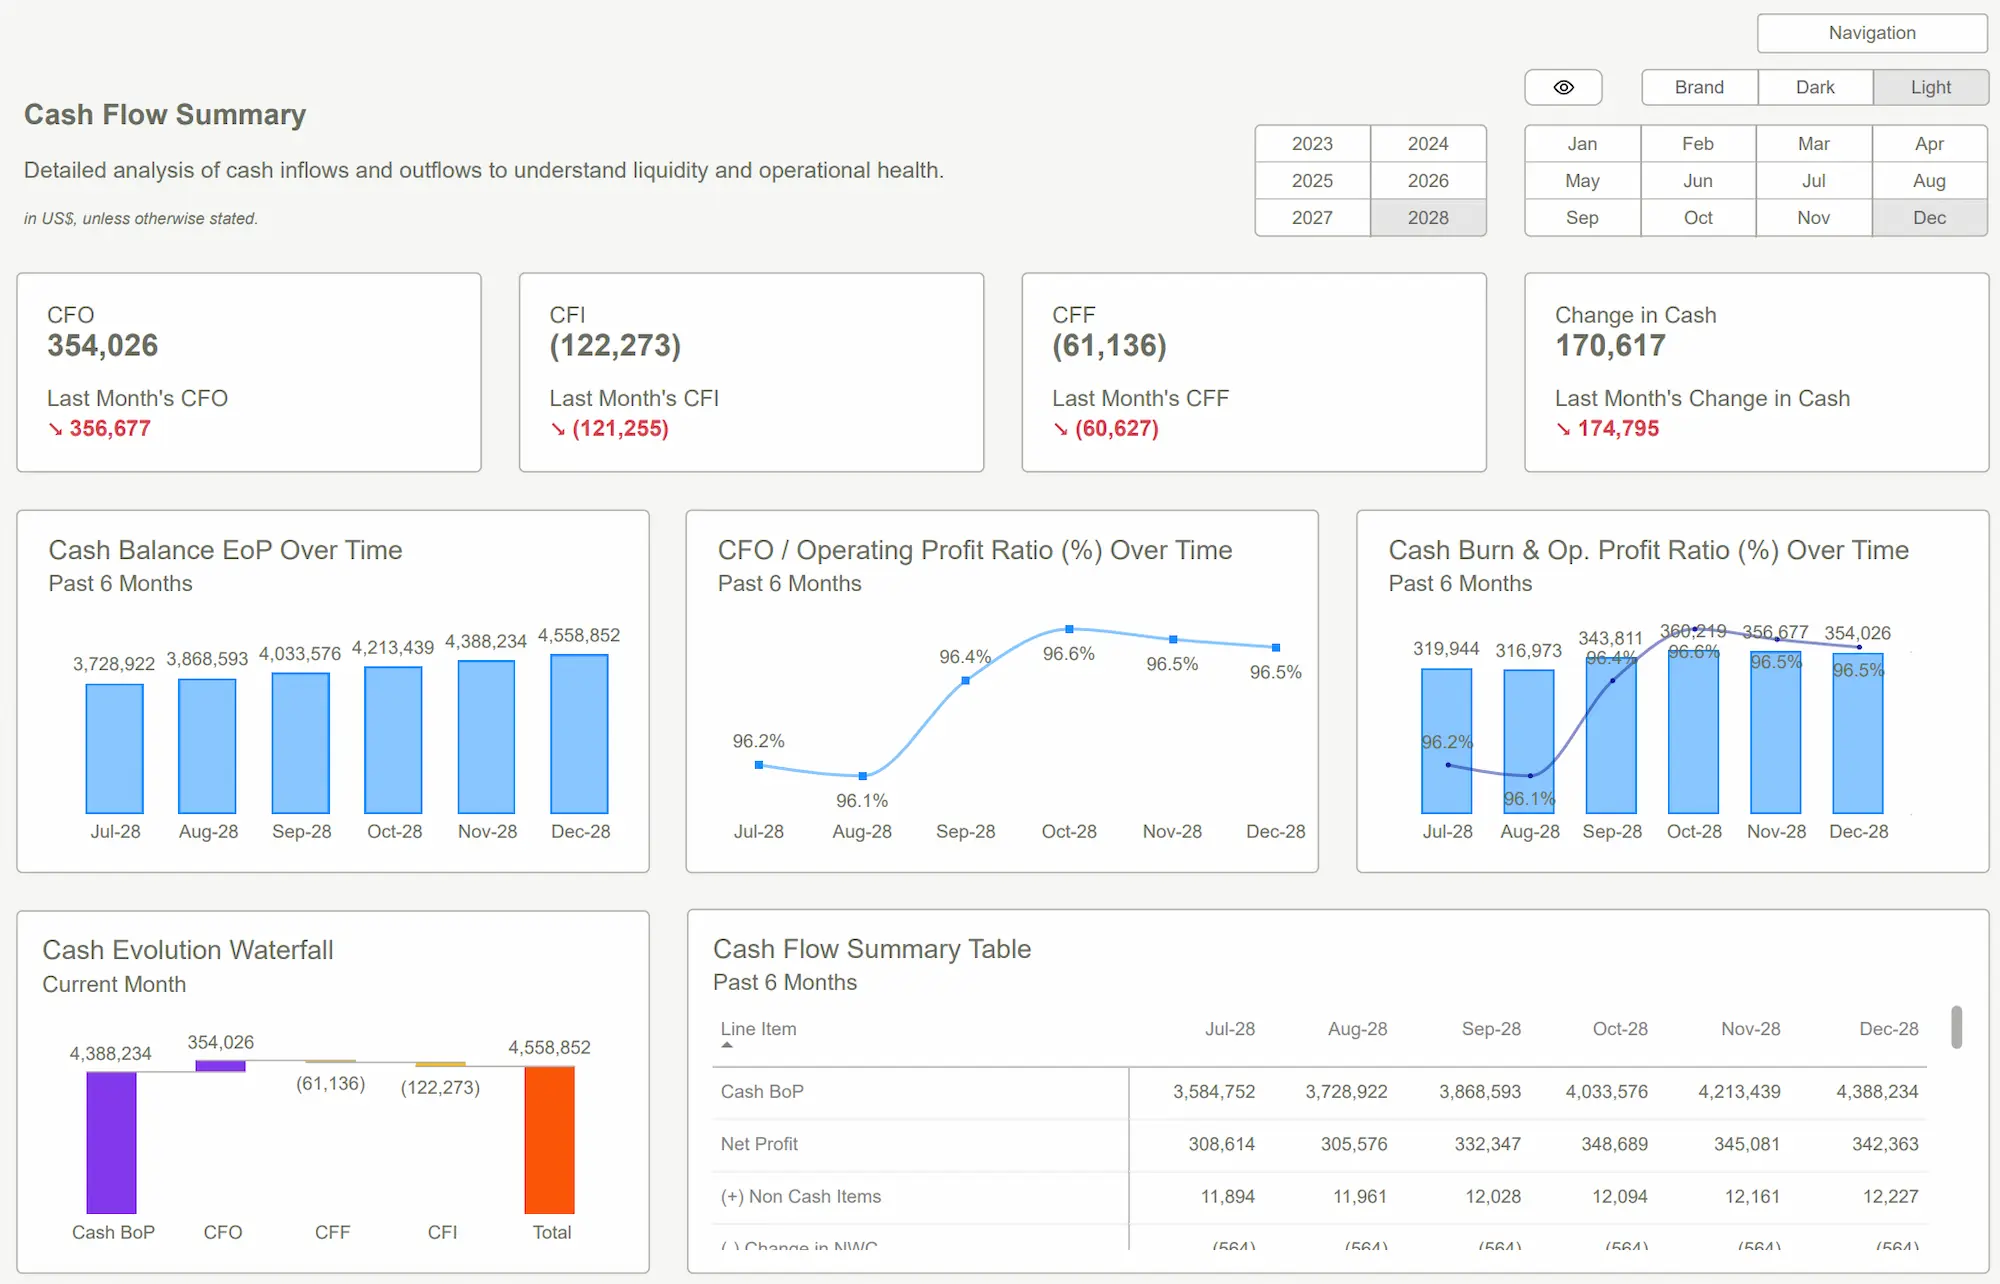
Power BI templates cut down report development time by a lot. They come with ready-to-use layouts, data models, and queries that help create new dashboards. These templates act as a foundation for consistent analytics across your organization. The .PBIT files are much smaller than standard .PBIX files. They create efficient templates with only the needed report definitions without data.
Pre-built dashboards and reports let analysts concentrate on data interpretation and decision-making instead of design work. Templates help maintain a professional look and speed up your reporting process. You can use them for financial analysis, marketing metrics, or operational insights. This piece will show you how to create Power BI templates that work. They will save hours of development time and raise your report's quality.
Understanding PowerBI Templates Fundamentals
Power BI templates help you tap into the full potential of your reporting capabilities. You need to understand their basic structure to make the most of them. Let's look at what makes these templates work and how they're different from standard reports.
What Are Power BI Templates (.PBIT Files)?
Power BI templates are pre-designed frameworks saved as .PBIT files that give you a starting point for new reports. These templates provide a structural blueprint without actual data, unlike standard reports. They work as reusable report layouts that include data connections, queries, measures, tables, charts, and visualizations—everything but the data itself.
Power BI removes all data when you create a template but keeps the report structure intact. This makes file sizes much smaller. A standard report might be 21MB while its template version could be just 61KB. The smaller size makes these templates easy to share with your team.
Key Components Included in a Power BI Template
A complete Power BI template has these important elements:
- Report pages and visualizations - The layout, charts, and visual elements
- Data model schema - Tables, relationships, measures, and model definitions
- Query definitions - All queries, parameters, and transformations
- Theme customizations - Color schemes, fonts, and styling elements
- Documentation - Optional descriptions and usage guidelines
Templates can include parameters that let users customize data sources when creating new reports. This feature helps template creators design solutions that work in different scenarios.
 Power BI Templates
How Templates Differ from Standard Reports
Templates and standard reports serve different purposes. Standard PBIX files contain both structure and data, while PBIT files include only the "DataModelSchema File" instead of the complete "DataModel File".
Users must refresh data connections with their own credentials when they open a template file. This step automatically turns the template into a standard PBIX file with actual data. Teams can share report designs without exposing sensitive information this way.
Templates save time for organizations that create multiple reports with similar themes. They also ensure standardization by providing consistent formatting, measures, and visualizations across reports. Organizations with strict branding guidelines or reporting standards find this consistency valuable.
A Power BI template works like a blueprint that lets developers focus on data analysis instead of rebuilding report structures from scratch.
Planning Your PowerBI Template Strategy
A well-planned strategy forms the foundation of effective Power BI templates. Organizations should first identify which reports provide maximum value through standardization across teams.
Identifying Reports Worth Templatizing
The right choice of reports determines successful template implementation. Teams should prioritize reports that match these criteria:
- Frequently created reports with similar structures but different data sources
- Reports requiring consistent branding across departments
- Dashboards needing regular updates with standardized visuals
- Reports with complex data models that could be reused
Teams should save templates for each layout design they plan to standardize throughout their organization. This practice will give a consistent visual appeal and reduce development time.
Documenting Template Requirements
Clear documentation guides template development effectively. The requirements document should cover:
Technical specifications that outline data source connections, refresh frequencies, and authorization levels. The document should specify "where your data is coming from, how to update it and how frequently, and any nuances of the report". This helps team members handle transitions smoothly.
The documentation should also include mockups of desired visualizations, key performance indicators, and audience-specific considerations. Teams find this information particularly useful during expansion or transitions.
Creating a Template Design System
A template design system serves as both a style guide and an asset kit. Teams should first set standards for layouts, color schemes, and visualization types. These elements can then become reusable templates.
Teams might want to create tiered templates for different skill levels—simple templates for entry-level users and advanced versions for experienced developers. This approach helps accommodate teams with varying capabilities.
Through collaboration with visual designers or data visualization experts can be "both powerful and invaluable" in developing professional template systems. Such collaborative efforts help create templates that combine visual appeal with analytical functionality.
Strategic template planning creates assets that save development time and maintain consistent reporting standards throughout the organization.

Step-by-Step PowerBI Template Creation Process
Power BI templates need a systematic approach that starts with a strong foundation. Let me get into the steps you'll need to build templates that save development time.
Setting Up the Data Model for Reusability
A well-laid-out data model serves as the life-blood of any Power BI template that works. Your first task should focus on dimension modeling, which lets your report be "sliced and diced as needed" since such models "take care of actual process and infinite possibilities to answer all questions". Your model schema should have clear relationships between fact and dimension tables to optimize query performance.
Standard naming conventions for tables, columns, and measures will make your template more reusable. This helps other users quickly grasp the model structure. On top of that, it helps to create calculation groups with Tabular Editor to develop reusable DAX measure groups that work with reports of all sizes.
Building Flexible Visualizations
Dynamic visualizations adapt to data requirement changes without needing redesign. Users can switch between different metrics on the same visual through dynamic measure selection techniques. The Q&A visual lets users "ask natural language questions and get answers in the form of a visual".
Your charts should avoid hard-coded references to specific data elements. Charts that respond to slicers and filters work better. This approach will give a template that combines smoothly with similar structured datasets.
Implementing Parameters for Data Source Flexibility
Parameters help templates connect to different data sources without changes. You can create parameters in Power Query by selecting "New Parameter" from the "Manage Parameters" dropdown in the Home tab. Each parameter needs properties like name, description, type, and suggested values.
Data source flexibility requires these steps:
- Create parameters for server name and database name
- Right-click your data source query and select the gear icon
- Select parameters from the dropdown in the connection window
- Apply parameters to your connection strings
This method lets users "change the underlying data source connection without having to redeploy the Power BI desktop file". Templates can move between development, testing, and production environments easily.
Adding Documentation Within Your Template
Detailed documentation turns a good template into an outstanding one. The model properties should include descriptions for tables, relationships, and measures. You might want to think about external tools like "Power BI Model Documenter" which "extracts information that is part of your data model" to create thorough documentation.
Report pages should have instructional text boxes that explain template usage to end-users. These guidance elements help new users understand parameter settings, visualization capabilities, and data refreshing procedures better.

Advanced Techniquesfor Time-Saving Templates
Lift your Power BI templates with advanced techniques that turn simple reports into powerful, reusable assets. These sophisticated approaches cut down repetitive work and maximize template flexibility.
Creating Dynamic Titles and Labels
Dynamic titles adjust automatically based on user interactions and provide immediate context for your data. You can implement this feature by creating a DAX measure that changes with filter context:
Dynamic Title =
IF (
ISFILTERED('Table'[Field]),
"Sales for " &SELECTEDVALUE('Table'[Field]),
"Sales for All Values"
)
The measure can be applied to your visual by selecting the conditional formatting (fx) button next to the title text in the format pane. Multi-language support comes from incorporating the USERCULTURE() function to display titles in the viewer's preferred language.

Building Conditional Formatting Rules
Conditional formatting helps users interpret data better by highlighting important information visually. You can adjust formatting rules dynamically based on slicer selections. This technique works effectively in tables, matrices, and most standard visuals.
Your formatting rules should use calculation measures instead of hard-coded values to make templates reusable. This approach maintains formatting consistency across reports while enabling customization.
Developing Reusable DAX Measure Groups
Calculation groups reduce redundant measures in your templates substantially. A single time intelligence calculation group can replace dozens of individual time-comparison measures.
The implementation process follows these steps:
- Create a calculation group in Model view
- Define calculation items using SELECTEDMEASURE() as a placeholder
- Apply calculation items to existing measures
This approach reduces template file size considerably while delivering consistent calculations.
Implementing Theme Customizations
Custom themes keep visual consistency in all template-derived reports. The theme modifications start from the View tab by selecting "Customize current theme". Advanced customization requires saving your theme as a JSON file and editing it to include your organization's colors, fonts, and visual styles.
Your customized theme should be saved with the template to maintain brand consistency effortlessly across all reports.
 Power BI Dashboard
Conclusion
Power BI templates are the core tools that help organizations create consistent reports efficiently. Good planning, development structure, and optimized techniques help teams cut down development time without compromising quality.
This complete guidegives you insights into:
- The basics of templates and their components
- Smart ways to implement templates
- How to create templates step by step
- Advanced methods for dynamic reports
- Ways to document properly
Templates make report creation quick and efficient. Teams can analyze data instead of rebuilding simple structures repeatedly. These templates can store complex data models, visualization settings, and DAX measures without actual data. This makes them perfect to standardize reports across your organization.
Dynamic elements, calculation groups, and parameter-driven flexibility make these templates work in different scenarios. Companies that use these methods save time, maintain consistency, and produce better reports.
Start with one common report type and build your template collection as you become skilled at these techniques. Your templates need regular updates based on what users say and how business needs change.
FAQs
Q1. What are PowerBI templates and how do they save time?
Power BI templates are pre-designed frameworks saved as .PBIT files that serve as starting points for creating new reports. They include report structures, data models, and visualizations without actual data, allowing users to quickly create consistent reports across an organization.
Q2. How do I createa Power BI template?
To create a Power BI template, start by building a report with the desired structure, data model, and visualizations. Then, save it as a .PBIT file, which strips out the data but preserves the report framework. Include parameters for data source flexibility and add documentation for ease of use.
Q3. What should Iconsider when planning a Power BI template strategy?
When planning a Power BI template strategy, identify reports that are frequently created or require consistent branding. Document technical specifications and create a design system that includes standards for layouts, color schemes, and visualization types.
Q4. Can Power BItemplates be customized for different data sources?
Yes, Power BI templates can be customized for different data sources by implementing parameters. This allows users to change the underlying data source connection without having to redeploy the entire report, making templates versatile across various scenarios.
Q5.What are some advanced techniques for creating time-saving templates?
Advanced techniques for creating time-saving templates include developing dynamic titles and labels, building conditional formatting rules, creating reusable DAX measure groups using calculation groups, and implementing custom themes for visual consistency across reports.
Download our professional Power BI Templates to build stunning dashboards, track key metrics, and turn data into actionable insights fast.Get Started >
Subscribe to our newsletter
Stay ahead with the latest insights, tips, and trends in PowerBI and data visualization.
Join the network that is unlocking the full potential of their data - one dashboard at a time.


